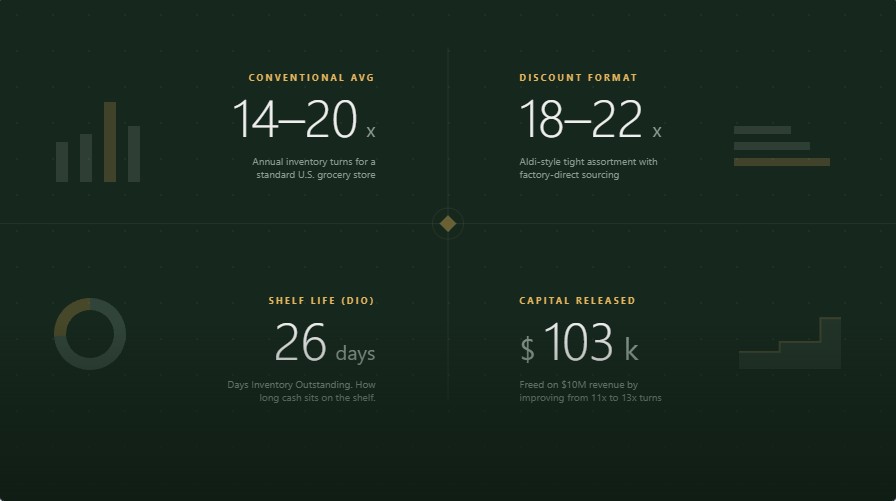
The average U.S. grocery store turns its inventory 14 to 20 times per year — roughly every 18 to 26 days — compared to 3–5 turns for furniture retail or 6–12 for apparel. Discount formats like Aldi push past 18–22x. Full-service supermarkets with deep center-store assortments often sit closer to 10–14x. The number that actually matters isn’t the ratio itself — it’s what a one-turn improvement does to the cash sitting on your shelves. Understanding this metric is crucial for accurate grocery store unit economics.
The Formula (And the Version Most People Get Wrong)
The standard grocery inventory turnover formula is Cost of Goods Sold (COGS) divided by Average Inventory. Some POS systems and internal sales dashboards calculate it using Revenue instead of COGS, which inflates the result — that variant is covered separately below.
Inventory Turnover Ratio = Cost of Goods Sold (COGS) ÷ Average Inventory
Two common mistakes distort this number in grocery specifically:
| Mistake | Why It’s Wrong | Fix |
|---|---|---|
| Using sales instead of COGS in the numerator | Inflates turnover because retail price includes margin, not just cost | Always use COGS, not revenue |
| Using ending inventory instead of average inventory | A single snapshot (e.g., post-holiday stock-up) skews the ratio up or down | Average inventory = (Beginning + Ending) ÷ 2, or average of 12 monthly closes for a more stable read |
Quick Reference: Turnover, Turns-to-Days, and What It Means
| Turnover Ratio | Days of Inventory (365 ÷ Turnover) | Typical For |
|---|---|---|
| 8–10x | 37–46 days | Small independent, broad center-store assortment |
| 12–14x | 26–30 days | Conventional supermarket (Kroger, Albertsons) |
| 15–18x | 20–24 days | Well-run neighborhood grocery, strong perishable mix |
| 18–22x | 17–20 days | Discount grocer (Aldi-style), limited SKU count |
| 25x+ | Under 15 days | Produce-heavy or convenience format with minimal dry goods |
The Alternative Formula: Revenue ÷ Average Inventory
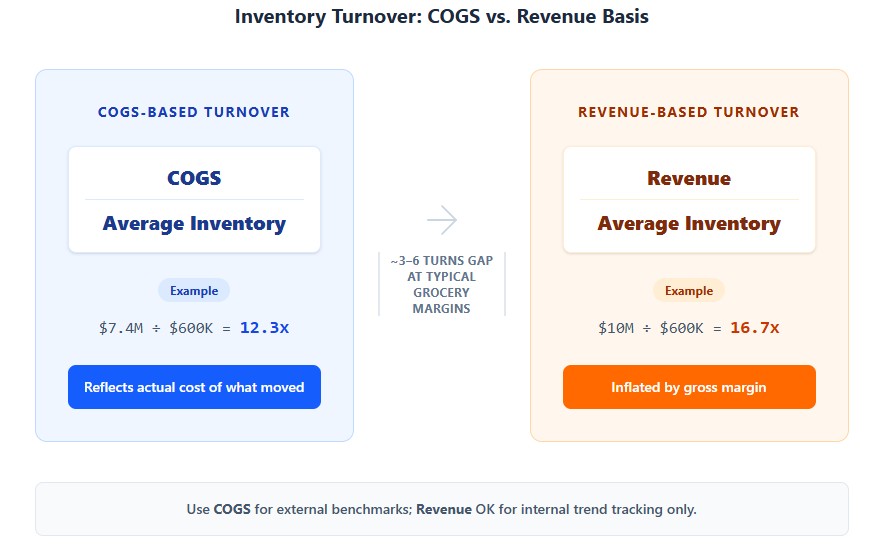
Some POS systems, franchise reporting templates, and internal sales dashboards calculate turnover as Revenue ÷ Average Inventory instead of COGS ÷ Average Inventory. It’s a legitimate second formula, not a mistake — but it produces a different, higher number, and mixing the two without labeling them is how a “22x” and a “16x” both get quoted for the same store in the same conversation.
| COGS-Based Turnover | Revenue-Based Turnover | |
|---|---|---|
| Formula | COGS ÷ Average Inventory | Revenue ÷ Average Inventory |
| Example ($10M revenue, 74% COGS, $600K avg. inventory) | $7.4M ÷ $600K = 12.3x | $10M ÷ $600K = 16.7x |
| Direction of bias | Reflects actual cost of what moved | Inflated by gross margin — the higher the margin, the bigger the gap |
| When it’s used anyway | Rarely for grocery; standard for financial/operational benchmarking | When COGS isn’t broken out in available reporting (some POS and franchise dashboards only report sales), or for a quick internal sales-velocity KPI that isn’t meant to be benchmarked externally |
The practical rule: if you’re comparing your number to an industry benchmark, a competitor, or a lender’s underwriting model, use COGS. If you’re only comparing your own store to your own store month over month using whatever your POS reports by default, the revenue-based version is internally consistent — just don’t quote it next to a COGS-based industry figure, since the gap (roughly the store’s gross margin percentage) makes an average grocery operation look 3–6 turns faster than it actually is.
Days Inventory Outstanding (DIO): The Same Number, Read as Cash
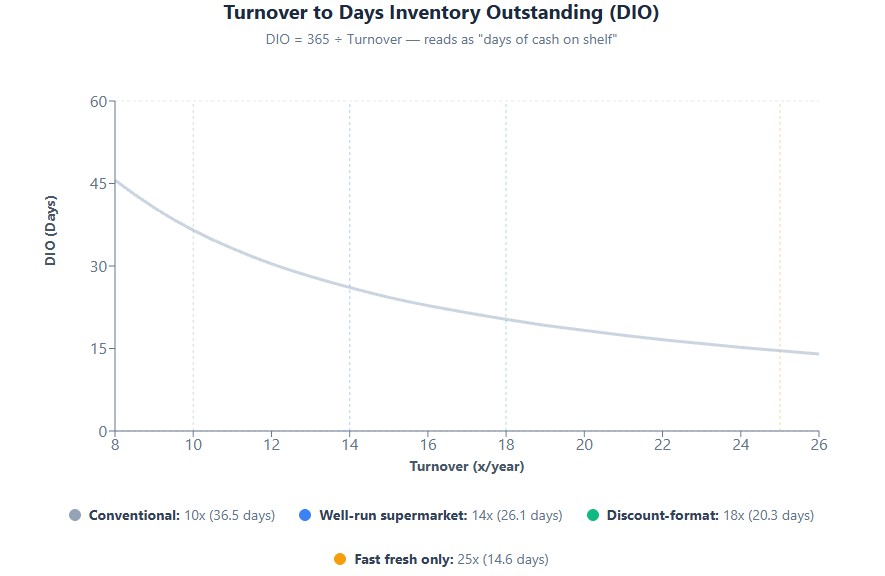
Turnover as a ratio (“14x per year”) is useful for benchmarking. Days Inventory Outstanding — also called Days Sales in Inventory (DSI) — converts the same figure into something a P&L or a lender reads more naturally: how many days of cash are sitting on the shelf right now.
DIO = 365 ÷ Inventory Turnover Ratio
| Turnover | DIO (Days) | Practical Read |
|---|---|---|
| 10x | 36.5 days | Over a month of cost of goods sold sitting in inventory at any given time |
| 14x | 26 days | Roughly what a well-run conventional supermarket carries |
| 18x | 20 days | Discount-format territory; tight but sustainable with reliable DSD |
| 25x | 15 days | Typical only for fast-moving fresh categories, not a store-wide average |
DIO matters more than the raw ratio in two specific situations: negotiating supplier payment terms (if your DIO is 26 days and your payment terms are net-30, your supplier is effectively financing your inventory — a materially different cash position than if your terms are net-14), and comparing across formats where SKU count differs so much that the ratio alone is misleading. Two stores can both report “14x,” but one carries that inventory in 26 days of fast-moving perimeter product and the other in 26 days of a much larger, slower center-store assortment — same ratio, very different risk profile. This is critical for effective grocery store cash flow management.
Benchmarks by Store Format
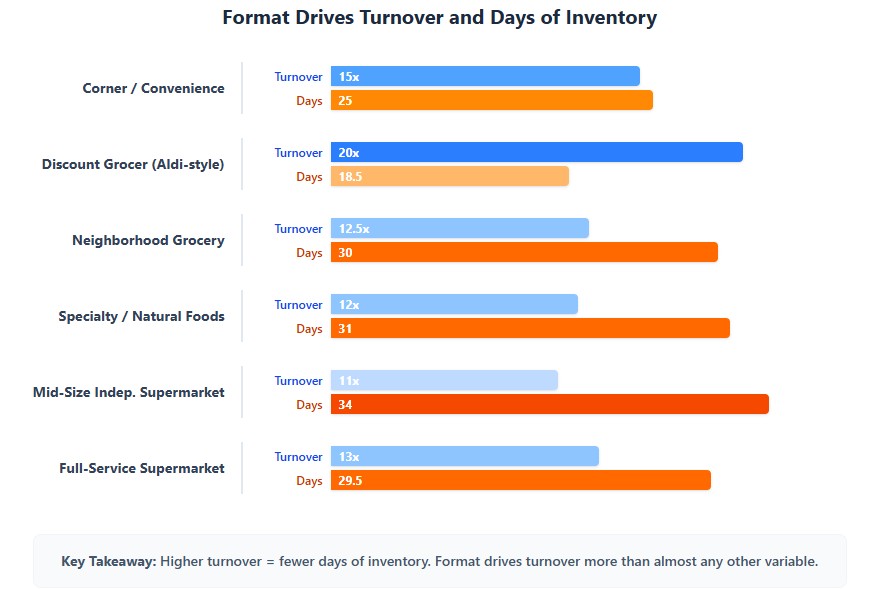
Format drives turnover more than almost any other variable, because SKU count and perishable mix determine how fast product has to move.
| Format | Typical SKU Count | Inventory Turnover | Days of Inventory | Why |
|---|---|---|---|---|
| Corner / Convenience Store | 500–2,000 | 12–18x | 20–30 days | High share of grab-and-go and beverage, low fresh/perishable exposure |
| Discount Grocer (Aldi-style) | 1,200–2,000 | 18–22x | 17–20 days | Limited assortment, high private-label share, direct-from-manufacturer sourcing |
| Neighborhood Grocery (Independent) | 2,500–5,000 | 10–15x | 24–36 days | Full departments but lower purchasing power than chains, less demand-forecasting sophistication |
| Specialty / Natural Foods | 4,000–8,000 | 10–14x | 26–36 days | Slower-moving specialty and supplement SKUs offset fast-moving fresh/organic produce |
| Mid-Size Independent Supermarket | 10,000–15,000 | 9–13x | 28–40 days | Broader center-store assortment dilutes the fast perishable turns |
| Full-Service Supermarket (Kroger-style) | 25,000–40,000 | 10–16x | 23–36 days | Deep long-tail SKU count drags the average down even as high-velocity categories turn weekly |
The trap in this table: a format-level average hides enormous variance inside a single store. A supermarket at “13x average” might be running produce at 40–60x and canned goods at 6–8x simultaneously. Managing to the store-level number instead of the category-level number is how operators end up either stocking out on milk or sitting on six months of canned pumpkin every October.
Benchmarks by Category (Where the Real Management Happens)
Grocery turnover is a category-management discipline, not a single company-wide dial. Here’s how turns vary by department, and what that means for cash tied up.
| Category | Annual Turnover | Days of Inventory | Shrink Rate | Management Approach |
|---|---|---|---|---|
| Produce | 40–70x | 5–9 days | 5–10% | Just-in-time delivery, often 3–6x per week; FEFO rotation mandatory |
| Dairy/Refrigerated | 20–30x | 12–18 days | 2–4% | Weekly or twice-weekly DSD (direct store delivery), strict date-code tracking |
| Meat/Seafood | 25–40x | 9–15 days | 3–5% | Case-ready product cycles fast; whole-muscle cuts slower |
| Bakery (in-store) | 50–100x | 4–7 days | 3–5% | Daily production runs, minimal held inventory by design |
| Frozen Foods | 10–15x | 24–36 days | 1–2% | Longer shelf life allows deeper buys, but freezer capacity caps volume |
| Center-Store Packaged Goods | 6–10x | 36–60 days | 1–2% | Lowest turn, longest shelf life; largest share of total inventory dollars |
| Health/Beauty/Pharmacy | 5–8x | 46–73 days | 2–3% | Slowest-turning category in the store; carried for basket completion, not velocity |
Category-level turnover isn’t broken out in SEC filings — public companies report inventory at the company level, not by department. The produce and bakery figures above sit at the high end of what’s commonly cited in grocery operations literature and vendor case studies (see the Afresh pilot data below for one directly measured example); treat them as an operational planning range, not an audited benchmark, and validate against your own POS data before setting category targets.
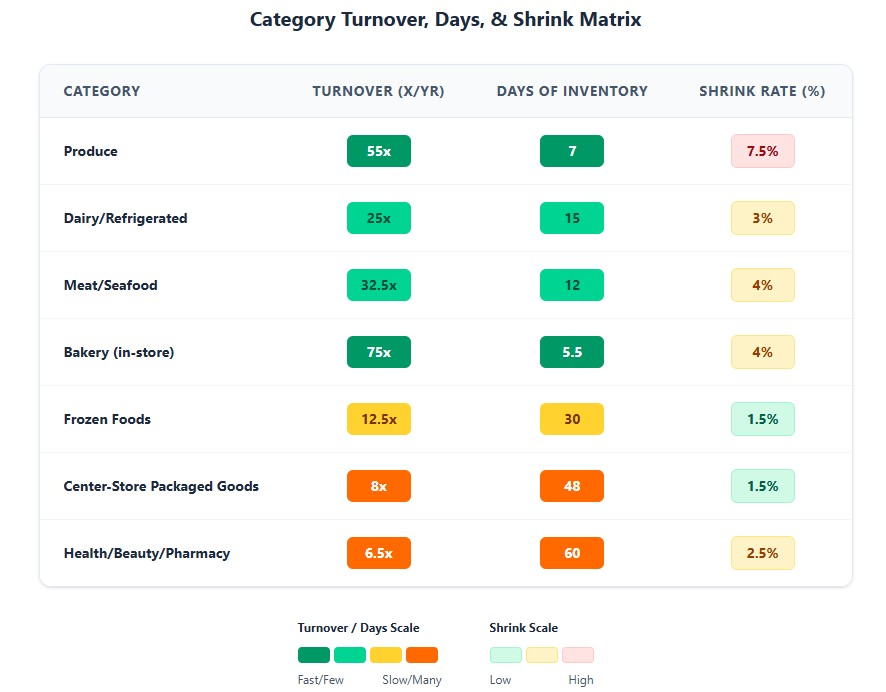
The center-store paradox: packaged goods turn the slowest of any major category, but because they occupy the most linear feet and the highest SKU count, they typically represent 35–45% of total inventory dollars in a conventional supermarket. A $3,000 pallet of canned goods turning once a year ties up the same capital as roughly 25–30 turns of produce at equivalent dollar value — capital that could otherwise fund a faster-turning category or reduce a credit line.
How Unrecorded Shrinkage Distorts the Turnover Number
The Shrink Rate column above isn’t just a loss-prevention metric — it directly corrupts the turnover calculation when it isn’t captured accurately, through a mechanic called phantom inventory.
Here’s the mechanism: Average Inventory in the turnover formula comes from your book (system) records, not a physical count. If a case of yogurt is stolen, or a flat of strawberries spoils and gets thrown out without a formal write-off, the point-of-sale and inventory system still shows that stock as “on hand.” The book inventory number is now higher than what’s actually sitting on the shelf or in the cooler.
That has two compounding effects:
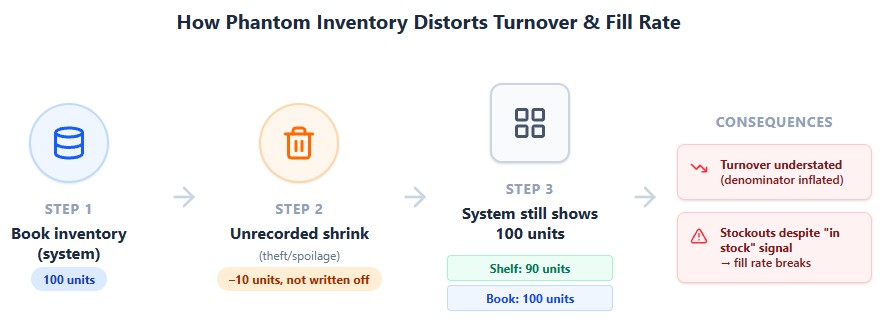
- Turnover looks worse than it is. Because Average Inventory (the denominator) is artificially inflated by stock that no longer physically exists, the calculated turnover ratio understates true operational efficiency — you’re being penalized in the metric for shrink you haven’t even measured yet.
- It causes the exact stockouts that break the fill-rate logic covered earlier. A reorder trigger based on book inventory won’t fire if the system believes stock is still available, even though the shelf is empty. This is the most common hidden driver of “the system says we have 12 units but the shelf is bare” — and it’s a bigger problem at self-checkout-heavy stores, where shrink rates run roughly 16x higher than at cashier-staffed lanes and go uncaptured for longer between physical counts. Learn more about shrinkage in grocery stores and how to reduce it.
The fix is cycle counting frequency, not just shrink reduction. A store that cuts shrink from 3% to 2% but only reconciles book-to-physical inventory quarterly is still carrying months of undetected phantom inventory in between counts. Weekly or biweekly cycle counts on high-shrink categories (produce, meat, dairy) close that gap faster than an annual full-store inventory ever will — which is also why RFID and computer-vision shelf monitoring are gaining adoption: they collapse the detection lag from weeks to near-real-time.
GMROI: What Turnover Alone Doesn’t Tell You
Turnover measures velocity. It says nothing about profitability. A SKU can turn 30 times a year and still contribute almost nothing to the bottom line if its margin is thin enough. The metric that combines both is Gross Margin Return on Investment (GMROI) — the standard retail measure of how many gross-margin dollars each dollar tied up in inventory generates.
GMROI = Gross Margin Dollars ÷ Average Inventory Cost
It can also be expressed as Turnover × Gross Margin %, which makes the relationship explicit: a fast-turning, low-margin category and a slow-turning, high-margin category can land at a similar GMROI — and a category that looks like a star on turnover alone can be a mediocre performer once margin is factored in.
| Category | Turnover | Gross Margin | GMROI (illustrative) | Read |
|---|---|---|---|---|
| Milk (loss leader) | ~25x | ~5% (near break-even) | ~$0.25 per $1 invested | High velocity, poor return — the category exists to drive traffic, not to be judged on GMROI |
| Center-store canned goods | ~8x | ~20% | ~$1.60 per $1 invested | Moderate velocity, moderate return — a solid, unremarkable contributor |
| Private label organic pasta | ~10x | ~38% | ~$3.80 per $1 invested | Slower than milk, but returns more than 15x as much gross margin per dollar of inventory |
| HBC/pharmacy | ~6x | ~50% | ~$3.00 per $1 invested | Slowest-turning category in the store, but among the best GMROI performers because margin compensates for velocity |
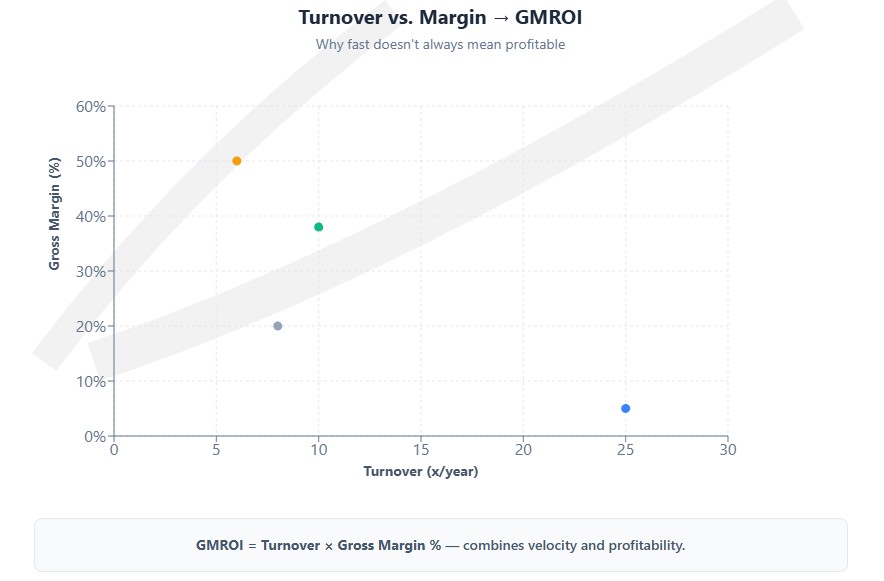
Figures above are illustrative, built from the turnover and margin ranges cited earlier in this piece, to show how the GMROI calculation behaves — not a published industry GMROI benchmark by category.
Why this matters for a turnover-focused review: ranking categories by turnover alone puts milk near the top and HBC near the bottom — the opposite of how they actually rank on return on inventory investment. Category managers who optimize purchasing and shelf space purely for turnover risk over-indexing on fast, thin-margin staples and under-investing in slower categories that are quietly doing more work for gross profit per dollar of inventory carried. For strategies to boost margins, consider our private label grocery strategy playbook.
How the Major Chains Compare
Public company filings give a rare, apples-to-apples look at how format and business model change the number.
| Company | Inventory Turnover (Cost Basis) | SKU Count | What Drives It |
|---|---|---|---|
| Aldi | ~18–22x | 1,400–1,600 | Factory-direct sourcing, 77–80% private label, minimal SKU depth per category |
| Costco | ~13x | ~4,000 | Bulk pack sizes offset by extremely high per-SKU volume; membership model tolerates a slower cash cycle than conventional grocery |
| Kroger | ~14–16x | 25,000+ | Deep long-tail assortment holds the average down; high-velocity perimeter categories turn far faster than the blended number suggests |
| Walmart (grocery + general merch. blended) | ~9x | Store-wide, general merchandise included | Blended figure is pulled down by non-grocery categories (apparel, electronics, home) that turn far slower than food |
| Trader Joe’s | Not publicly disclosed; estimated 15–20x | ~4,000 | Curated, zero-national-brand assortment with high per-SKU velocity and no long tail |
Public figures calculated from cost of goods sold divided by average reported inventory, most recent fiscal year filings. Private companies (Trader Joe’s, Aldi US) are industry estimates, not disclosed figures. CSIMarket’s aggregate grocery-industry inventory turnover (cost-of-sales basis) has historically run in the 13–14x range across its published industry composite, which is the closest thing to an audited cross-company baseline for the sector.
Turnover Is Not “Higher Is Always Better” — The Stockout Trade-Off
A rising turnover ratio is treated as an unambiguous win in most retail content. In grocery, it isn’t — because the two failure modes sit on opposite sides of the same lever.
| Turnover Direction | What It Signals When It’s Good | What It Signals When It’s a Problem |
|---|---|---|
| Rising turnover | Tighter demand forecasting, less capital tied up, less shrink on perishables | Chronic understocking, missed sales on fast-movers, empty shelf perception hurting basket size |
| Falling turnover | Deliberate inventory build for a promotion or seasonal peak | Overbuying against MOQ requirements, slow-moving SKUs never rationalized, cash trapped in center-store |
The industry rule of thumb: a fill rate below roughly 95–97% on core, high-velocity SKUs (milk, eggs, bread, bananas) alongside a rising turnover number usually means the ratio is improving because the store is running out of product, not because it’s managing inventory better. Turnover has to be read next to fill rate and out-of-stock frequency, never alone.
The Cash Flow Math: What One Turn Is Actually Worth
Turnover isn’t an abstract efficiency score — it converts directly into cash. Here’s the model for a mid-size independent supermarket.
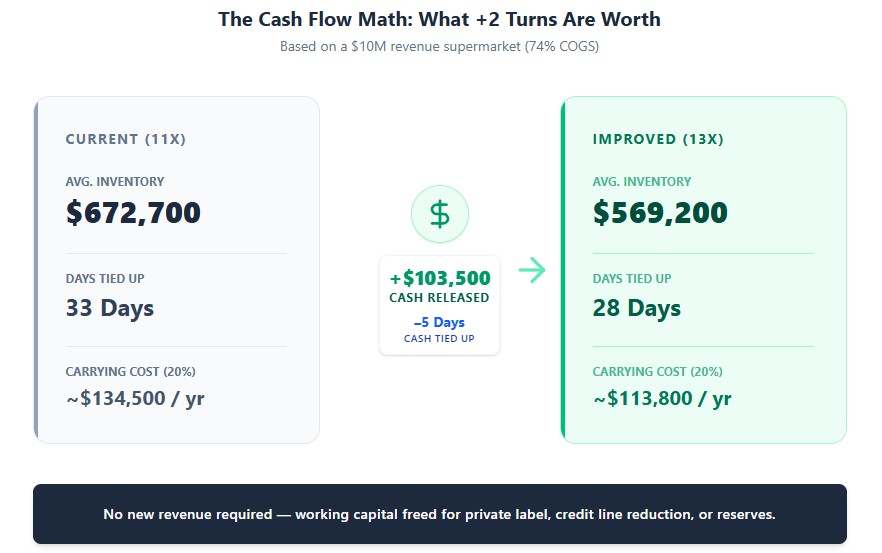
Assumptions: $10M annual revenue, 74% COGS ($7.4M annual COGS), currently turning inventory 11x per year.
| Metric | Current State (11x) | Improved State (13x) | Difference |
|---|---|---|---|
| Average inventory required | $7.4M ÷ 11 = $672,700 | $7.4M ÷ 13 = $569,200 | $103,500 released |
| Days of inventory | 33 days | 28 days | 5 fewer days of cash tied up |
| Carrying cost avoided (at 20% annual carrying cost)* | — | — | ~$20,700/year |
*Carrying cost includes warehouse/shelf space opportunity cost, refrigeration/utilities on held perishables, insurance, and capital cost — commonly modeled at 20–30% of average inventory value annually in retail.
The $103,500 released by moving from 11x to 13x turnover doesn’t require new revenue — it’s cash that can fund a private label launch, cover a slow season without a credit line draw, or get folded into the working capital reserve most new stores underfund in year one. Use our break-even analysis tools to model how these savings impact your profitability timeline.
What Actually Moves the Turnover Number
| Lever | Typical Turnover Impact | Notes |
|---|---|---|
| AI demand forecasting (tools like Afresh, Shelf Engine) | +10–20% improvement in turns on perishables | Payback typically 6–18 months via combined shrink reduction and turnover gain |
| SKU rationalization (killing bottom 10–20% of slow movers) | +5–15% on center-store turnover | Requires 90-day sell-through data before cutting; premature cuts remove seasonal or loyalty-driver items |
| Direct Store Delivery (DSD) vs. warehouse distribution | Category-dependent; DSD categories (snacks, beverages, bread) turn 2–4x faster | Trades higher per-unit cost for lower held inventory and fresher product |
| Electronic Shelf Labels + dynamic markdown | +5–10% recovery on near-expiry perishables before write-off | Markdown timing captured automatically rather than manually walked by staff |
| Reduced MOQ dependency (regional wholesalers, buying co-ops) | Can lower effective turnover in year one | Smaller, more frequent orders improve turns but raise per-unit cost 5–10% — a direct trade-off against gross margin |
| Private label expansion | Marginal turnover improvement, larger margin improvement | Private label SKUs typically match or slightly lag national brand turns but carry 25–35% higher margin per unit sold |
Real-World Case: What a Measured Turnover Improvement Looks Like
Most “AI improved our turns” claims in grocery trade press are vendor marketing copy without a number attached. One with an actual before/after figure: Cub Foods, the Minnesota grocery chain owned by United Natural Foods (UNFI), piloted Afresh’s demand-forecasting and replenishment platform across its produce departments. Over the pilot period, Cub reported:
| Metric | Result | What Drove It |
|---|---|---|
| Sales | +2.5% | Fewer stockouts on fast-moving produce SKUs from tighter demand forecasts |
| Inventory on hand | –7.4% | Reduced over-ordering; forecasts replaced manual, experience-based ordering |
| Inventory turns | +6.7% | Direct result of the on-hand reduction combined with stable or improved sales |
Source: Afresh customer results, published case data (afresh.com/customers). Cub Foods cited over-ordering on some items and under-ordering on others as the starting problem — a forecasting-accuracy issue, not a demand problem — which is why the fix moved turns without cutting assortment.
The pattern worth noting: the turnover gain wasn’t the product of ordering less across the board. It came from ordering closer to actual demand on a SKU-by-SKU basis — the same over/under-ordering pattern shows up in center-store inventory when it isn’t managed at the category level, which is the gap the checklist below is meant to close.
How to Set Up Category-Level Turnover Tracking
Store-wide turnover is easy to calculate and easy to misread. Category-level tracking takes more setup but is what actually lets you act on the number.
| Step | What to Set Up | Cadence |
|---|---|---|
| 1. Data source | Pull COGS and inventory value from your POS/inventory management system at the category or department level, not just the store total. Most modern cloud POS systems (and any AI forecasting tool) support this natively; older systems may require a manual export and category mapping. | One-time setup, then automated |
| 2. Averaging period | Use trailing 12-month average inventory by category, not a single snapshot — a point-in-time balance right after a promotional buy-in or holiday stock-up distorts the ratio for months if left uncorrected. | Rolling monthly recalculation |
| 3. Review frequency | Fast-turning categories (produce, dairy, bakery) reviewed weekly; center-store and slower categories reviewed monthly. Reviewing everything on the same cadence either buries the fast-moving signal in noise or reviews slow categories too often to see meaningful change. | Weekly (fresh) / monthly (center-store) |
| 4. Paired metrics on the same dashboard | Turnover alone doesn’t flag whether a rising number is healthy, or whether a category is actually profitable. Pair it with fill rate/out-of-stock frequency (to catch stockout-driven turnover spikes) and GMROI (to catch fast-but-thin-margin categories getting more shelf space than their return justifies) on the same dashboard. | Same dashboard, same cadence as turnover |
| 5. Ownership | Assign category-level turnover to the department head or category manager who actually places the orders — a single store-wide number reported only to ownership or the general manager doesn’t change purchasing behavior at the shelf level. | Ongoing, tied to ordering role |
Common Turnover Mistakes at the Store Level
| Mistake | Consequence | Correction |
|---|---|---|
| Tracking turnover store-wide only, not by category | Fast perimeter categories mask a bloated, slow center-store assortment | Track turnover by department minimum, by category ideally |
| Chasing MOQ discounts on slow movers | Distributor minimum order quantities ($2,500–$5,000/SKU) push overbuying on categories that don’t need the volume | Model true carrying cost against the MOQ discount before accepting it |
| Confusing high turnover with high profitability | A fast-turning loss leader (milk, eggs) contributes little gross margin dollar-for-dollar versus a slower-turning specialty item | Pair every turnover review with a GMROI review (turnover × margin), not just a velocity review |
| Ignoring seasonal distortion in the average inventory calculation | A single year-end snapshot post-holiday buildup understates true turnover | Use trailing 12-month average inventory, not a point-in-time balance |
| Over-rotating to just-in-time without a demand-shock buffer | Tighter turns increase exposure to supply disruptions — wholesale egg prices rose roughly 60% year-over-year into early 2025 as avian flu cut commercial flocks, and a ~17–21% federal duty on Mexican tomatoes took effect in mid-2025 after the U.S. withdrew from the prior suspension agreement | Maintain a defined safety-stock buffer (typically 10–15% above modeled demand) on categories with volatile supply risk |
2026–2028 Outlook
| Factor | Effect on Turnover | Timeline |
|---|---|---|
| AI forecasting adoption scaling past early adopters | Category-level turnover improvements of 10–20% become achievable for mid-size independents, not just large chains, as tool pricing drops | 2026–2027 |
| Tariff-driven produce cost volatility (Mexican tomatoes carry a ~17–21% duty since mid-2025; Mexico supplies roughly 70% of U.S. tomato consumption and 90%+ of avocados) | Retailers holding larger produce safety buffers to hedge against price spikes, temporarily lowering produce turnover in affected categories | Ongoing through 2026 as costs pass through to shelf prices |
| Private label penetration growth (24–26% toward 28–30% of unit volume by 2028) | Modest turnover neutral-to-positive effect; larger effect on blended gross margin than on turns | 2026–2028 |
| Continued self-checkout and RFID-based shrink reduction | Tighter shrink numbers indirectly support higher effective turnover by reducing “phantom inventory” gaps between system and shelf counts | 2026–2028 |
Frequently Asked Questions
What is a good inventory turnover ratio for a grocery store?
Most conventional supermarkets fall between 10x and 16x annually; discount formats run higher, specialty and independent stores often run lower. There’s no single “good” number outside the context of your format and category mix.
Is higher inventory turnover always better?
No. Turnover has to be read alongside fill rate. A rising ratio driven by chronic stockouts on fast-moving SKUs is a worse outcome than a stable ratio with consistent product availability.
How do you calculate inventory turnover without COGS?
Use Revenue ÷ Average Inventory instead of COGS ÷ Average Inventory. It’s a valid internal tracking method when COGS isn’t available in your reporting, but it produces a higher number than the standard formula and shouldn’t be compared directly against COGS-based industry benchmarks.
What is DIO (Days Inventory Outstanding)?
DIO converts the turnover ratio into days: 365 ÷ Inventory Turnover. It answers “how many days of inventory am I holding right now,” which is often more actionable for cash flow and supplier-terms decisions than the ratio itself.
What is GMROI and how is it different from inventory turnover?
GMROI (Gross Margin Return on Investment) measures profitability per dollar of inventory, not just velocity. Turnover can tell you a category moves fast; GMROI tells you whether moving fast is actually making money, since it factors in gross margin alongside turns.