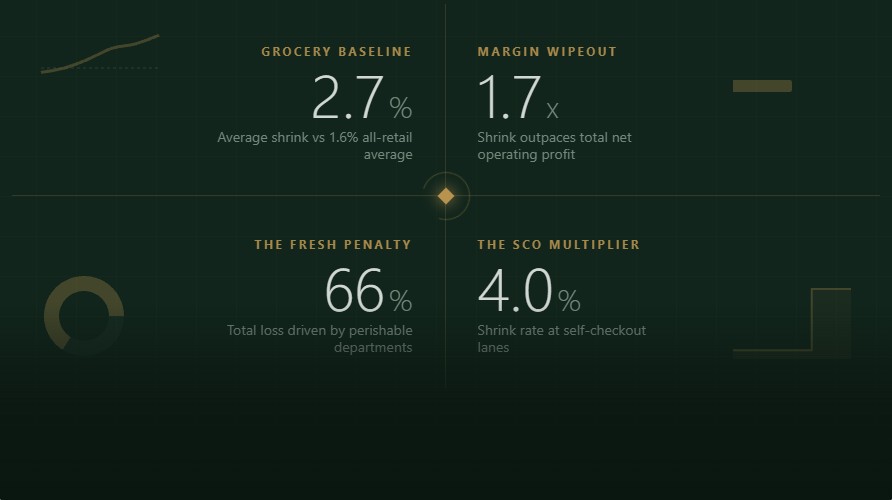
Grocery stores lose 1.76% to 3.1% of sales to shrinkage, roughly double the all-retail average — and unlike apparel or electronics, most of that loss isn’t theft at all. It’s a rotisserie chicken that didn’t sell by close, a case of strawberries that turned before the truck was unloaded, and a receiving count that was never double-checked. On a category already running 1.5%–2.5% net margins, a shrink rate above 2% isn’t a rounding error — it’s routinely larger than the store’s entire profit.
There’s a data problem worth flagging up front: the National Retail Federation, the source every retail-shrink statistic ultimately traces back to, discontinued its 32-year annual National Retail Security Survey after publishing FY2022 figures (1.6% of sales, $112.1 billion industry-wide), citing the “evolving nature” of retail loss (Retail Dive, 2024). Every “current” shrink statistic you’ll find elsewhere online is either that 2022 number recycled, or a vendor-reported figure from a loss-prevention technology company with an obvious incentive to make the problem look large and their solution look effective. This piece treats both categories of data honestly — flagging which numbers are benchmarked, which are estimates, and which are marketing.
Grocery Shrink Benchmarks: A Timeline of a Fragmented Number
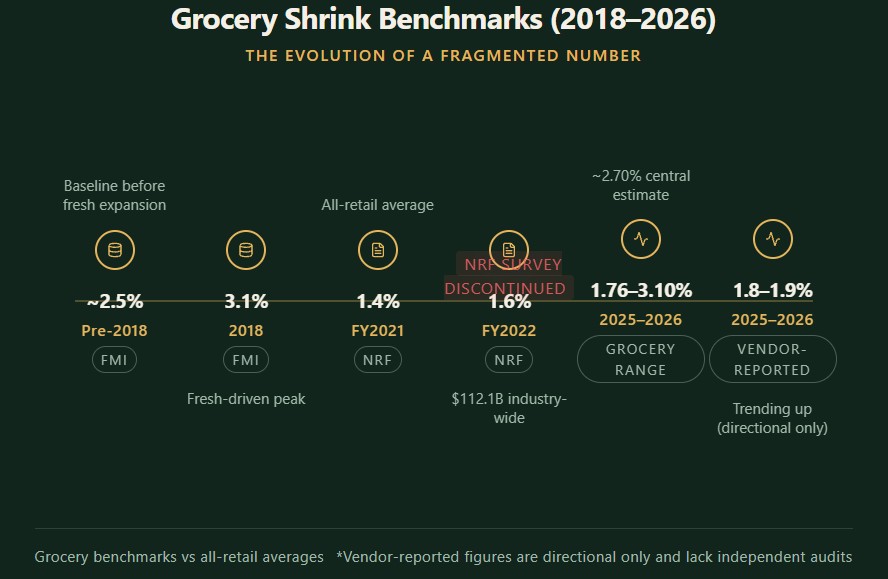
There is no single current, universally-cited grocery shrink percentage the way there is for general retail. The most detailed grocery-specific benchmark still in circulation — a department-level breakdown from the Food Marketing Institute’s Food Retailing Industry Speaks research — is now six years old. That’s the honest starting point for interpreting everything below.
| Period | Reported Shrink Rate | Source | Notes |
|---|---|---|---|
| Pre-2018 baseline | ~2.5% of sales | FMI historical benchmark | Cited as the “normal” reference point before the fresh-food expansion accelerated |
| 2018 | 3.1% overall store shrink | FMI Food Retailing Industry Speaks / Food Industry Speaks 2019 | Driven by retailers’ push into fresh, prepared, and expanded perishable SKU counts |
| FY2021 (all retail) | 1.4% of sales | NRF National Retail Security Survey | Not grocery-specific; grocery consistently runs above the all-retail figure |
| FY2022 (all retail) | 1.6% of sales, $112.1B industry-wide | NRF National Retail Security Survey | Last published NRF shrink benchmark; survey discontinued after this cycle |
| 2025–2026 (grocery-specific, commonly cited range) | 1.76%–3.10% of sales, ~2.70% central estimate | Grocery loss-prevention benchmarking studies (FMI-linked) | Range reflects wide variance by format — conventional supermarket vs. independent vs. small-format |
| 2025–2026 (vendor-reported, unverified) | 1.8%–1.9% of sales, trending up | AI/computer-vision vendor market research | Directional only — no independent audit trail; treat as an upper-bound signal, not a benchmark |
The takeaway: whichever number you anchor to, grocery shrink sits meaningfully above the all-retail average, and — unlike apparel, electronics, or general merchandise — the gap is explained almost entirely by one thing the rest of retail doesn’t have to manage at scale: perishability.
Shrink by Department: Where the Money Actually Disappears
Store-wide shrink percentages hide the real story. Grocery operators manage shrink at the department level because that’s the only level at which it’s actionable — and the data shows an enormous split between perishable and center-store categories.
| Department | Share of Total Store Shrink | Department Shrink Rate | Share of Store Sales | Illustrative Annual Shrink ($) |
|---|---|---|---|---|
| Meat | 18% | 4.1%–5.7% | 12% | ~$93,000 |
| Produce | 16% | 4.8%–5.3% | 9% | ~$82,000 |
| Deli | 14% | 7.8%–8.7% | 5% | ~$74,000 |
| Grocery (center-store, dry) | 14% | 1.1%–1.2% | 34% | ~$71,000 |
| General Merchandise | 8% | 2.7% | 8% | ~$41,000 |
| Bakery | 6% | 8.0%–8.5% | 2% | ~$30,000 |
| Seafood | 5% | 6.2%–7.6% | 2% | ~$24,000 |
| Pharmacy (Rx) | 5% | 2.2% | 6% | ~$25,000 |
| Dairy/Refrigerated | 4% | 1.5% | 7% | ~$20,000 |
| Health & Beauty | 3% | 2.5% | 3% | ~$14,000 |
| Floral | 2% | 5.1% | 1% | ~$10,000 |
| Frozen | 2% | 0.8% | 5% | ~$8,000 |
| Beer/Wine/Liquor | 2% | 1.0% | 5% | ~$9,000 |
Illustrative figures scaled to a ~$19M-revenue store, based on widely-cited grocery loss-prevention benchmarking data. Individual store performance varies significantly by format, region, and category mix.
How to read these two columns — they answer different questions, not the same one.
“Department Shrink Rate” is that department’s own loss as a percentage of that department’s own sales. This is the number that tells you whether a department is being run well. Bakery at 8.0%–8.5% is a red flag on its own terms, regardless of how big or small the bakery department is relative to the rest of the store.
“Share of Total Store Shrink” is what percentage of the store’s total dollar loss that department contributes. This is the number that tells you where to spend your limited loss-prevention attention first. Meat contributes the largest slice (18%) not because its rate is the worst (it isn’t — deli and bakery run higher rates), but because it combines a high rate with a large sales base.
Confusing the two leads to a common, costly mistake: chasing the department with the scariest-looking rate (bakery, at 8%+) while ignoring the department generating the largest dollar loss (meat, at 18% of total shrink). Both numbers matter, but they point to different actions — a high rate with a small sales base calls for a process fix (tighter date-checking, better markdown timing); a high total-dollar contribution calls for investment prioritization regardless of whether the underlying rate looks dramatic.
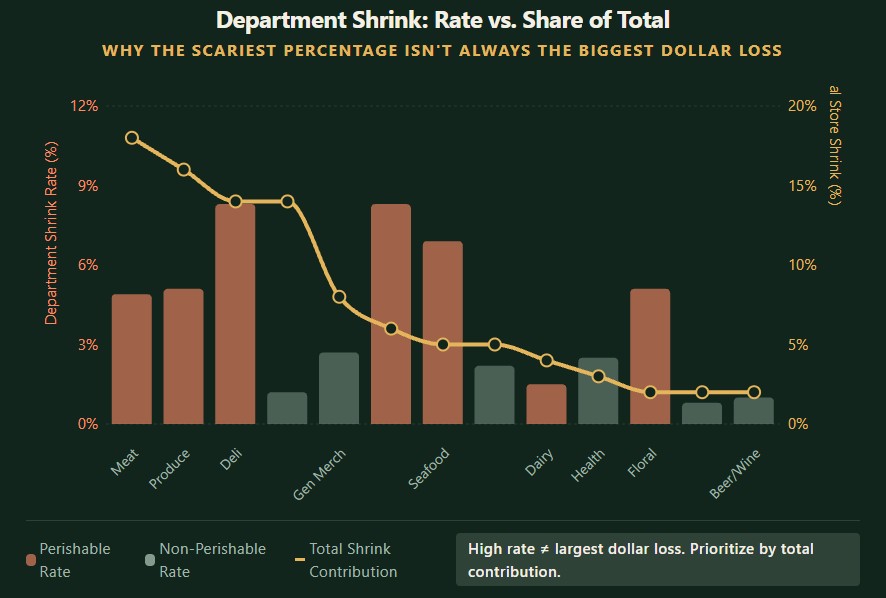
The structural insight: perishable departments (meat, produce, deli, bakery, seafood, floral) account for roughly two-thirds of total store shrink while generating just over a third of total sales. Compare that to the margin structure of those same departments — deli and bakery post the highest gross margins in the store (50%–65%), but shrink of 7.8%–8.5% eats most of that advantage before it ever reaches net profit. A department that looks like your best margin performer on a P&L summary is often your worst shrink performer on a department audit, and the two numbers rarely appear on the same page. Understanding these dynamics is key to mastering grocery store unit economics.
The Composition of Shrink: Four Universal Causes, One Grocery-Specific Fifth
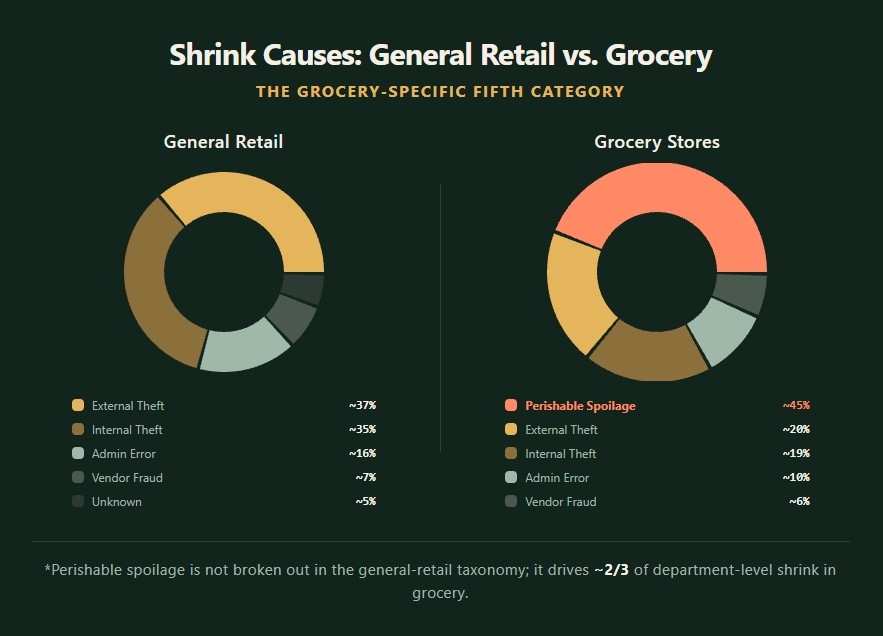
General retail shrink breaks down into four buckets. Grocery adds a fifth that general-merchandise retailers simply don’t carry at the same scale.
| Cause | Share of Shrink (General Retail Benchmark) | Grocery-Specific Behavior |
|---|---|---|
| Internal / employee theft | ~29%–42% of shrink (~$26B annually, industry-wide) | Includes register “sweethearting” (scanning a cheaper item or skipping a scan for a friend/family member), deli/bakery giveaways, receiving-dock diversion |
| External theft / shoplifting | ~36%–37% of shrink (avg. incident value ~$461) | Concentrated in high-value, easily-resold items: meat, infant formula, over-the-counter health items, spirits |
| Administrative / paperwork error | ~12%–19% of shrink | Receiving discrepancies, price-file errors, damaged-goods write-off failures — amplified in grocery by SKU counts running 10x–25x higher than a typical general-merchandise store |
| Vendor fraud / error | ~5%–9% of shrink | Short shipments, invoice mismatches — caught primarily through daily receiving reconciliation against distributor EDI compliance terms (98% inbound fill rate, 92% on-time delivery) |
| Perishable spoilage (grocery-specific) | Not broken out in general-retail taxonomy — folded into “unknown loss” | Accounts for roughly two-thirds of department-level shrink dollars in grocery; driven by shelf-life windows, ordering-to-demand mismatches, and temperature-chain failures |
One frequently cited but effectively unverifiable industry estimate puts the average grocery store’s monthly loss to register-level “sweethearting” alone at around $5,000 — treat that as directional, not audited, but it illustrates why register-level exception reporting (flagging voids, discounts, and no-sale transactions by cashier) remains one of the highest-ROI internal controls available, regardless of the exact dollar figure.
Self-Checkout: The Single Biggest Structural Shift in Grocery Shrink Since Loss-Leader Pricing
No single operational change in the last decade has moved grocery shrink numbers more than self-checkout adoption, and the data on it is unusually consistent across independent studies — which is rare enough in this topic that it’s worth treating as reliable.
| Metric | Value | Source |
|---|---|---|
| Self-checkout share of grocery transactions (2025–2026) | ~40% industry-wide; up to 55%–80% at some conventional supermarket formats | Industry adoption studies |
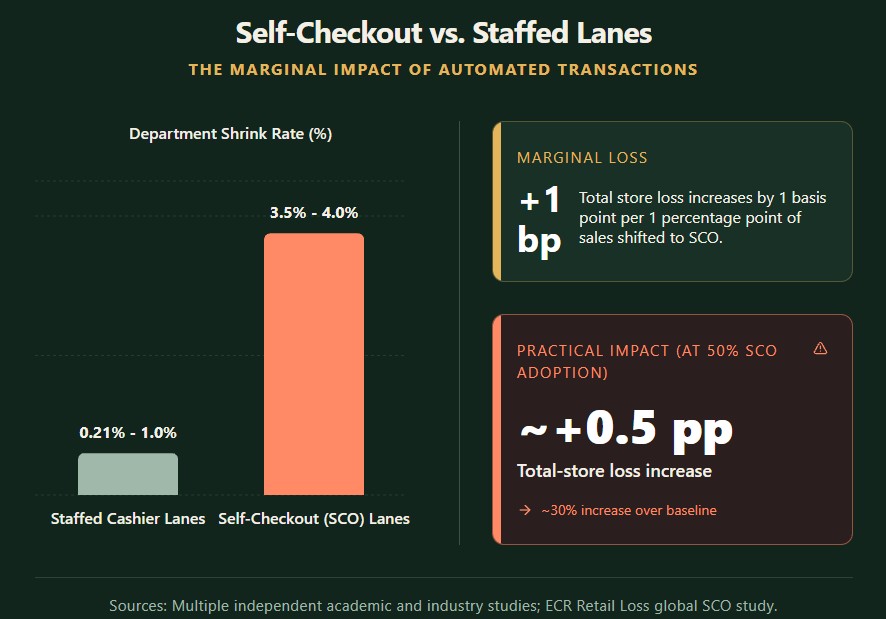
| Shrink rate at self-checkout lanes | 3.5%–4.0% | Multiple independent academic and industry studies |
| Shrink rate at staffed cashier lanes | ~0.21%–1.0% | Same studies, same store base |
| Relative shrink multiple | Roughly 4x–16x higher at self-checkout, depending on methodology | Convergent across sources |
| Marginal loss relationship | For every 1 percentage point of sales shifted to fixed self-checkout, unknown loss rises by roughly 1 basis point | ECR Retail Loss global self-checkout study |
| Practical impact at 50% self-checkout adoption | Approximately +0.5 percentage points of total-store loss — a ~30% increase over a typical grocery retailer’s baseline shrink rate | Same study |
How self-checkout shrink actually happens (from one of the only granular, cause-level breakdowns available, a 2006 industry survey still cited because no comparably detailed replacement exists): roughly half of self-checkout shrink comes from customers physically “sliding” an item past the scanner without ringing it up — sometimes accidentally, often not. The remainder splits across attendant-processed refunds and voids, cash skimmed during manual card-entry overrides, coupon fraud, and attendant-customer collusion. The mechanism has stayed remarkably stable even as the technology around it has changed — modern AI-vision overlays are essentially built to interrupt this exact behavior sequence in real time rather than catch it after the fact in a stock count.
The clearest real-world signal that this isn’t a manageable rounding error: Wegmans, a chain with a reputation for operational sophistication, pulled self-checkout lanes from its stores in 2022, citing unspecified but material shrink losses. Most chains haven’t followed — the labor-cost savings from self-checkout are large and immediate, while the shrink cost is diffuse and shows up months later in a physical inventory count — but the tradeoff is now explicit rather than assumed.
Organized Retail Crime in Grocery: A Different Shape Than General Merchandise
Organized retail crime (ORC) — coordinated theft by criminal networks for resale, as distinct from opportunistic shoplifting — hits grocery differently than it hits electronics or apparel retailers, because grocery’s most resellable category is fresh protein, not consumer tech.
| Metric | Value |
|---|---|
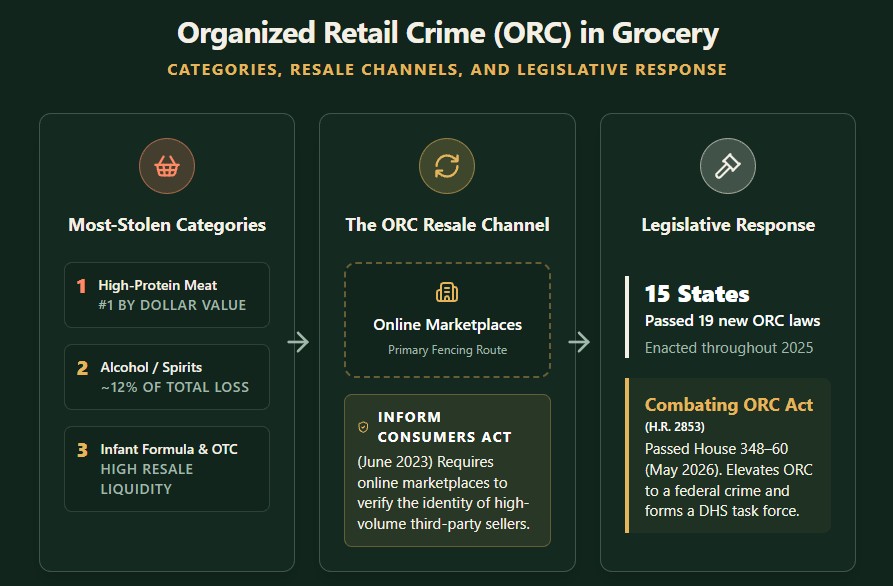
| Most-stolen grocery category by dollar value | High-protein meat |
| Alcohol’s share of total grocery retail loss | ~12% |
| ORC’s estimated share of total U.S. retail shrink | Contributing meaningfully to $45B+ of the $112B+ total, though no federal or state agency publishes a definitive attributed figure |
| Shoplifting incident growth reported by retailers, 2019–2022 | ~70%–93% depending on how the comparison is framed (see caveat below); +18% specifically 2023–2024 |
| Retailers reporting involvement of transnational organized crime groups | 67% |
| Share of retailers reporting fewer than half of theft incidents to police | 64% |
| Consumers who believe retail theft affects the prices they pay | 79% |
A credibility caveat worth stating plainly, since it’s exactly the kind of thing this article is trying to flag elsewhere: the NRF itself has had to walk back an ORC statistic before. In 2023, after reporting scrutiny, the NRF removed a claim that organized retail crime accounted for “nearly half” of all shrink, acknowledging the figure had been misattributed from an unrelated six-year-old survey. Separately, independent analysis has pointed out that the NRF’s widely-quoted “93% increase in shoplifting since 2019” framing is a perception-survey result from loss-prevention executives, not a measurement comparable to the NRF’s own historical shrink-as-percentage-of-sales data, which stayed comparatively flat over the same period. None of this means ORC isn’t a real and growing problem for grocery specifically — the meat-theft and alcohol-theft figures above are operationally consistent with what loss-prevention teams report — but the aggregate dollar and percentage figures circulating in ORC coverage deserve more skepticism than the department-level shrink data earlier in this article, which comes from physical inventory counts rather than perception surveys.
The legislative response accelerated sharply through 2025–2026. Fifteen states passed 19 new organized-retail-crime laws in 2025 alone (including Nevada, Pennsylvania, Wisconsin, Texas, Florida, and Oklahoma), and four more states — Wisconsin, Oregon, Wyoming, and Kansas — signed ORC-specific legislation by March 2026. More than 30 state ORC laws have been amended or newly enacted since 2022. At the federal level, the Combating Organized Retail Crime Act (H.R. 2853) — not to be confused with earlier, differently-scoped bills carrying similar names — passed the House 348–60 on May 12, 2026 (confirmed via Grassley Senate press release; NRF’s own statement on passage), with backing from the NRF, RILA, and more than 260 businesses. The bill would designate ORC a federal crime and stand up a DHS-coordinated task force — a real development grocery operators should track, since it would extend federal ORC enforcement resources to food retailers alongside general merchandise chains, but as of this writing it awaits Senate action and is not yet law.
This builds on the INFORM Consumers Act, in effect since June 2023, which requires online marketplaces to verify the identity of high-volume third-party sellers — the direct response to fencing operations moving stolen grocery and health-and-beauty inventory through anonymous online storefronts. It’s a useful reminder that grocery loss prevention no longer ends at the parking lot; a meaningful share of ORC-driven grocery shrink is only recoverable by disrupting the resale channel, not the in-store theft event.
Before/After: Two Verified Grocery Shrink Reductions
Most “shrink reduction” numbers online come from vendor case studies with no independent audit trail. These two are exceptions worth citing by name, because both are publicly documented outside the vendor’s own marketing.
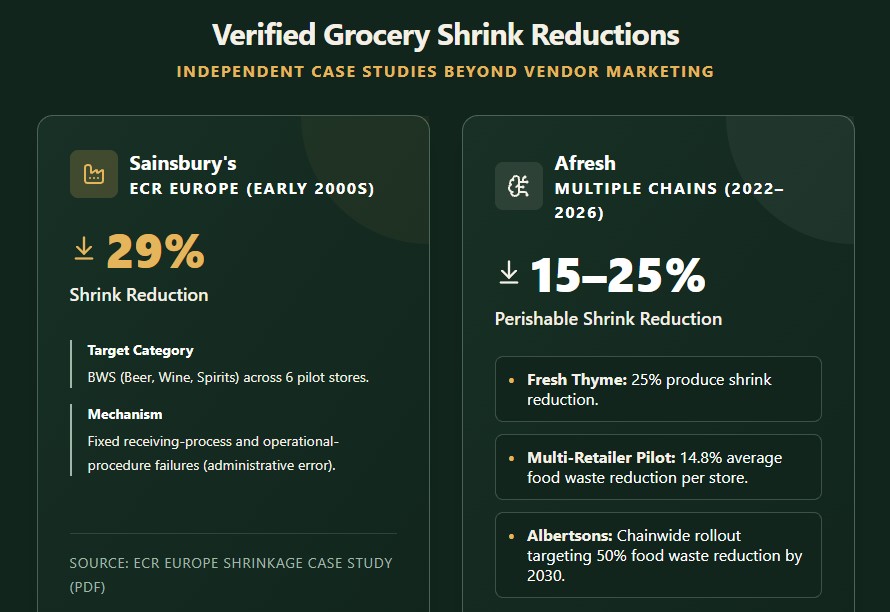
Receiving reconciliation — Sainsbury’s, UK beer/wine/spirits category. In an ECR Europe-documented supply-chain shrinkage project, Sainsbury’s worked with its BWS suppliers (including Diageo and Allied Domecq) to trace shrinkage back through the supply chain rather than treating it as an in-store theft problem. The root cause turned out to be receiving-process and operational-procedure failures — exactly the “administrative error” category this article covers above. The pilot, run across six stores, delivered a 29% reduction in shrinkage (ECR Europe shrinkage case study, PDF). It’s a dated (early-2000s) study, but the mechanism — that a large share of “shrink” is actually a supply-chain reconciliation failure wearing a theft-shaped label — still holds and is echoed in the EDI-compliance point above.
AI perishable forecasting — Afresh, multiple named grocery chains. Afresh’s fresh-department demand-forecasting platform has the most independently-corroborated shrink data of any grocery-specific loss-prevention technology, because multiple named retailers have confirmed results publicly rather than through anonymized vendor case studies:
| Retailer / Study | Reported Result | Source |
|---|---|---|
| Two large (unnamed) retailers, multi-store pilot | 14.8% average reduction in food waste per store, positive ROI within 8 weeks | Pacific Coast Collaborative AI food-waste case study, 2022 (PDF) |
| Albertsons (2,200+ stores, chainwide rollout) | Deployed after an internal pilot, targeting a 50% food-waste reduction by 2030 | Grocery Dive |
The consistency across three independent sources (a specific named regional chain, an independently published multi-retailer pilot study, and a chainwide enterprise rollout decision) is what makes the 15%–25% perishable-shrink-reduction range in the technology table below one of the more defensible numbers in this space, rather than a single vendor’s own claim.
Technology and Reduction Strategies: What’s Verified, What’s Vendor Math
This is the section where most guides on this topic quietly stop distinguishing between an independently benchmarked result and a number a vendor put in their own case study. Both are included below — labeled.
| Method | Typical Cost | Claimed / Reported Shrink Reduction | Confidence Level |
|---|---|---|---|
| POS exception reporting (flags voids, discounts, no-sales by cashier/register) | Often bundled into existing POS; $150–$400/month standalone SaaS | Directly reduces employee-theft-driven shrink; magnitude varies too widely by baseline to generalize | Moderate — mechanism is well-established, results are store-specific |
| Self-checkout AI vision + weight-sensor cross-reference | $15,000–$40,000 per store | Vendors report 30%–50% reduction in self-checkout-specific shrink | Low-moderate — plausible mechanism (catches “sliding” and ghost scans in real time), but figures are largely vendor-reported |
| General computer-vision behavioral analytics (floor-wide, non-biometric) | $8,000–$25,000 per store | Vendors report 20%–56% reduction in floor-level theft shrink | Low — wide range across vendors is itself a signal that these figures aren’t independently standardized |
| RFID / electronic shelf label cross-referencing with inventory systems | See detailed cost breakdown in our grocery startup-cost analysis ($15K–$200K+ depending on scale) | Primarily an inventory-accuracy and out-of-stock tool; shrink benefit is secondary and indirect | Moderate for inventory accuracy; low for direct shrink attribution |
| AI demand/inventory forecasting (Afresh, Wasteless, Shelf Engine-type tools) | $5,000–$20,000 one-time + $200–$600/month | 15%–25% reduction specifically in perishable shrink via better ordering-to-demand matching | Highest of this table — corroborated across three independent sources (named retailer, published multi-retailer study, chainwide rollout decision); see case studies above |
| Distributor EDI compliance discipline (98%+ inbound fill rate, 92%+ on-time delivery tracking) | Operational process, near-zero incremental cost | Directly reduces vendor-fraud and receiving-error shrink by closing the reconciliation gap at the dock | High — this is a controllable, auditable process rather than a probabilistic detection claim |
The pattern worth noticing: the highest-confidence reduction levers in this table are the least glamorous ones — daily receiving reconciliation and demand-matched ordering — not the AI camera systems most vendor content leads with. That doesn’t mean computer vision doesn’t work; it means the industry hasn’t yet produced the kind of standardized, third-party-audited reduction figures for it that exist for older, more boring controls.
What Shrink Actually Costs, at Scale
The percentage is abstract. The dollar figure against your actual margin structure isn’t.
| Annual Store Revenue | Shrink at 1.5% (low end) | Shrink at 2.5% (industry-relevant midpoint) | Shrink at 3.1% (FMI high-end benchmark) |
|---|---|---|---|
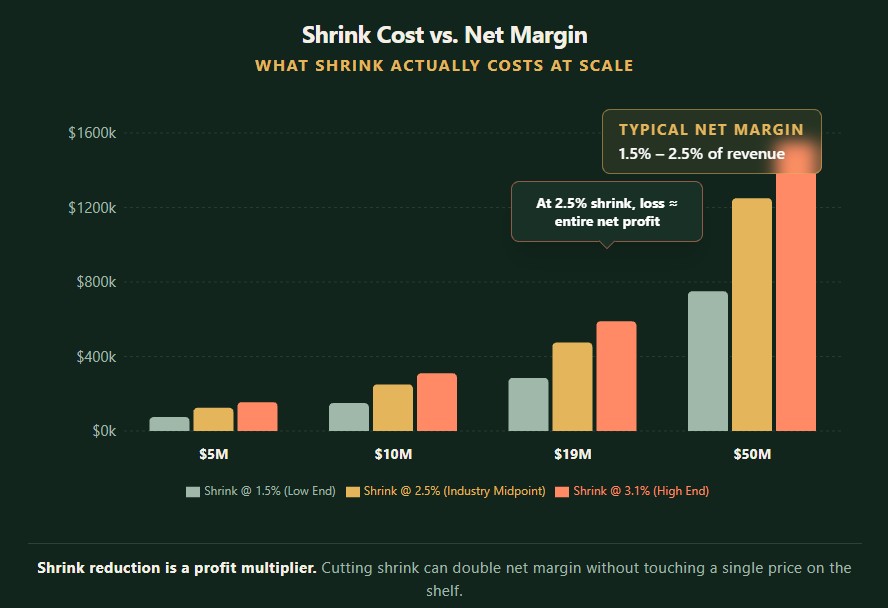
| $5 million | $75,000 | $125,000 | $155,000 |
| $10 million | $150,000 | $250,000 | $310,000 |
| $19 million (illustrative mid-size independent) | $285,000 | $475,000 | $589,000 |
| $50 million | $750,000 | $1,250,000 | $1,550,000 |
Set that against the net margin data for conventional supermarkets: 1.5%–2.5% net profit is the entire operating result most grocery formats produce in a normal year. A store running a 2.5% shrink rate isn’t losing a slice of its profit to shrink — it’s losing an amount roughly equal to its entire profit margin to shrink, before a single other cost line is considered. That reframes shrink reduction from a loss-prevention line item into one of the few levers in grocery retail capable of doubling net margin without touching a single price on the shelf. Use our break-even analysis tools to model how reducing shrink impacts your path to profitability.
Calculating Your Own Shrink Rate Before You Benchmark It
Before comparing your number to any threshold below, make sure it’s calculated the same way the benchmarks are — this is where most internal comparisons quietly go wrong.
Book inventory value is what your POS/inventory system says you should have on hand, based on receipts minus recorded sales. Physical inventory value is what a hand count (or cycle count) actually finds on the shelf and in the back room.
Step 1 — Calculate the shrink value:
Shrink Value = Book Inventory Value − Physical Inventory Value
Step 2 — Express it as a rate, using the denominator that matches what you’re comparing against:
| Method | Formula | When to Use It |
|---|---|---|
| % of book inventory value | Shrink Value ÷ Book Inventory Value × 100 | Measures inventory-control accuracy at a single point in time — how much of what you think you have is actually missing |
| % of sales (retail convention) | Shrink Value ÷ Total Sales for the Period × 100 | The convention NRF and FMI use in every benchmark cited in this article — this is the number to calculate if you’re comparing against the thresholds below |
Worked example:
| Line Item | Value |
|---|---|
| Book inventory value (per POS/inventory system) | $500,000 |
| Physical inventory value (actual count) | $487,500 |
| Shrink value | $12,500 |
| Shrink rate, % of book inventory | $12,500 ÷ $500,000 = 2.5% |
| Total sales for the same quarter | $1,600,000 |
| Shrink rate, % of sales | $12,500 ÷ $1,600,000 = 0.78% |
The same $12,500 loss produces a 2.5% figure and a 0.78% figure depending only on the denominator. If you calculate shrink as a percentage of inventory internally and then compare it directly to the percentage-of-sales thresholds below, you’ll misdiagnose your store in one direction or the other — convert first.
Benchmarking Your Own Number
Given how fragmented the published data is, the more useful exercise for most operators is comparing their own shrink rate against directional thresholds rather than chasing a single “correct” industry average.
| Signal | Total Store Shrink | What It Usually Means |
|---|---|---|
| Strong performance | Below 1.5% of sales | Tight receiving controls, disciplined perishable ordering, low self-checkout exposure or strong SCO monitoring |
| Normal range | 1.76%–2.70% of sales | Typical for a full-service conventional supermarket with standard perishable department mix |
| Elevated — investigate | 2.70%–3.10% of sales | At or above the FMI high-end historical benchmark; worth a department-level audit before assuming it’s “just produce” |
| Red flag | Above 3.10% of sales, or any single perishable department above 10% | Points to a specific, fixable failure — receiving process, a particular shift, a particular register, or a supplier relationship — rather than generalized “shrink” |
The department-level breakdown earlier in this piece matters more here than the store-wide number: a store at a “normal” 2.2% overall can still be masking a deli department bleeding at 12%+ that a blended average makes invisible.
2026–2028: What’s Changing in Grocery Shrink Management
Three shifts are reshaping how grocery operators will approach shrink over the next two to three years.
Detection is moving from retrospective to real-time. The historical model — a monthly or quarterly physical inventory count reveals shrink after the fact — is being replaced by continuous cross-referencing of POS transaction data against camera and weight-sensor input at the point of loss. This doesn’t eliminate shrink; it changes the intervention point from “next month’s audit” to “this transaction,” which is a meaningfully different operational posture even before you evaluate any specific vendor’s reduction claims.
The resale channel is under more legislative pressure than the theft event itself. Between the INFORM Consumers Act’s marketplace-seller verification requirements and the state-level ORC legislative wave of 2025–2026, policy is converging on the idea that disrupting where stolen grocery inventory gets converted to cash is more tractable than stopping every individual theft event in-store. Operators tracking ORC exposure should watch enforcement data from this legislation as closely as their own in-store shrink numbers.
The self-checkout tradeoff is becoming an explicit line item rather than an assumed convenience. As the ECR Retail Loss basis-point relationship between self-checkout adoption and total shrink becomes more widely cited, expect more chains to make the Wegmans-style calculation explicit: is the labor savings from a given self-checkout adoption rate larger or smaller than the incremental shrink it generates at this store’s theft-risk profile? That calculation will increasingly vary by neighborhood and format rather than being a single company-wide policy.
Six No-Cost Operational Fixes That Move Shrink Now
None of the six requires capital investment, and together they cover four of the five causes discussed above — internal theft, administrative error, vendor fraud, and perishable spoilage — leaving only external theft and self-checkout exposure to the technology and legislative levers covered elsewhere in this piece.
- FEFO rotation (First-Expired, First-Out), not FIFO. Rotate stock so the unit closest to its sell-by date is always in front, checked at every restock — not once a week during a scheduled walkthrough. This single habit is the highest-leverage, zero-cost lever against the perishable shrink that makes up roughly two-thirds of department-level losses. For more on managing this, see our guide on COGS for grocery stores.
- Written cold-chain temperature logs, checked at fixed intervals. A log for every reach-in and walk-in cooler, signed off at opening, midday, and closing. A cooler running a few degrees warm for 48 hours is a spoilage event a temperature log catches before it becomes an unsellable case of dairy or deli meat — not after.
- Two-person verification on DSD (Direct Store Delivery) receiving. DSD vendors (bread, snacks, soda, chips) typically invoice and stock their own shelves without a manager present to verify quantities. Requiring a second employee to confirm delivered quantity against the invoice before anyone signs closes one of the most common vendor-fraud and short-shipment gaps in a small store — the same root cause the Sainsbury’s case study above addressed at scale.
- Same-shift write-off logging. When a case of produce is pulled for spoilage or a damaged item is found, log it in the POS/inventory system that shift — not at the next physical count. This is the direct, no-cost fix for the phantom-inventory problem above: an unlogged loss stays invisible to whatever system decides when to reorder, until a shelf goes empty and a sale is lost on top of the original loss. Monitoring your inventory turnover ratio can help identify these discrepancies earlier.
- Register exception review, even without dedicated software. A manager spot-checking the daily void/discount/no-sale report by cashier — a report most POS systems generate by default — catches the majority of “sweethearting” patterns before they become habitual, without paying for a separate exception-reporting module.
- A named owner and a deadline for every audit finding. A shrink or cold-chain issue flagged during a walkthrough that isn’t assigned to a specific person with a specific deadline tends, in practice, to reappear at the next audit unresolved. This is the difference between a shrink number that’s merely documented and one that actually moves.