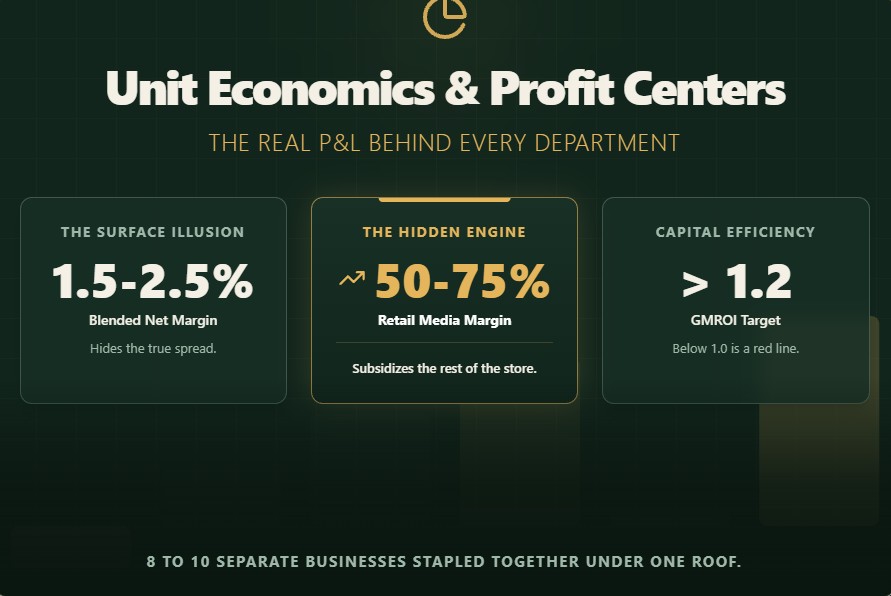
A grocery store isn’t one business earning 1.5%–2.5% net margin. It’s eight to ten separate businesses stapled together under one roof — food (barely breaking even), pharmacy (thin but stable), fuel (near-zero on the pump, meaningful on loyalty), retail media (50%+ margin), and e-commerce (frequently negative) — and the blended number on the income statement hides which of those businesses is actually carrying the other seven. Understanding these dynamics is crucial when conducting a SWOT analysis for your grocery store.
Key takeaways
- Grocery’s blended 1.5%–2.5% net margin hides a wide spread across departments: retail media runs 50%–75% margin, online delivery is frequently negative once fulfillment cost is subtracted.
- GMROI, not gross margin %, should drive SKU cuts. Grocery’s benchmark is 1.2–2.0; below 1.0 is a red line regardless of how good the margin percentage looks.
- Self-checkout shrink rises 22%–33% per ECR Retail Loss’s 2026 study — not the unsupported “16x” figure that circulates without a traceable source.
- Before building a micro-fulfillment center or dark store, verify 500+ orders/day and a $40+ basket in your trade area. Kroger’s $2.6 billion write-down (November 2025) shows order density, not technology, is the binding constraint.
4 Key Grocery Store Unit Economics Metrics
| Unit of Measurement | Formula | US Benchmark (2025–2026) | Source |
|---|---|---|---|
| Revenue per square foot | Annual department revenue ÷ selling sq ft | $965–$1,020/yr avg conventional; $19.59/week (2025) | FMI Food Industry Facts, 2025 |
| Sales per labor hour | Total sales ÷ total labor hours worked | $217.83 | FMI Food Industry Facts, 2025 |
| GMROI | Gross margin $ ÷ average inventory cost | 1.2–2.0 for grocery overall | Industry retail-analytics benchmarks (Shopify, SPS Commerce, Eightx GMROI guides, 2026) |
| Contribution margin per transaction | (Basket $ × gross margin %) − fulfillment cost | $49.06 in-store vs. $106 online avg. basket | FMI Food Industry Facts, 2025 |
Why this matters more than the headline margin: a $50M-revenue supermarket at 1.7% net margin nets $850,000 — the average net profit for food retailers was 1.7% in 2024 and roughly 2.1% in 2025 (FMI, 2025). That number is the sum of a food business losing money in some weeks, a pharmacy adding steady thin profit, and increasingly a retail media line that can represent a disproportionate share of total store profit despite being under 1% of revenue. Cut a department based on the blended margin alone, and you can gut the traffic driver that made the profitable departments profitable. For a deeper dive into these figures, see our comprehensive guide on grocery store profit margins.
How to Calculate Supermarket Revenue per Square Foot
Formula: Revenue per sq ft = Annual department revenue ÷ selling square footage
| Format | Annual Sales/Sq Ft | Source |
|---|---|---|
| Conventional Supermarket (avg.) | ~$965–$1,020 ($19.59/wk × 52) | FMI, 2025 |
| Trader Joe’s | ~$1,723 | Progressive Grocer / JLL retail productivity survey |
| Whole Foods | ~$930–$937 | Progressive Grocer / JLL retail productivity survey |
| Convenience-format grocery (<3,000 sq ft) | $600–$800 | Industry retail-benchmark aggregators (BusinessDojo, Solink, 2026) |
| Supercenter format | $400–$500 | Industry retail-benchmark aggregators (BusinessDojo, Solink, 2026) |
| General retail (all sectors, for comparison) | $325–$350 | JLL / Progressive Grocer retail productivity survey |
Red line: under $300–$400/sq ft in a conventional center-store layout.
If you’re below the red line, do this:
- Pull a 12-month sales report sorted by linear foot, not by SKU count — dead space hides inside categories that look fine in aggregate.
- Identify the bottom 15%–20% of SKUs by GMROI (not just by margin %) in that space — see the GMROI section below for the formula.
- Reallocate the freed footage to a department already running above $700/sq ft in your store (deli, prepared foods, or a retail-media display), not to more of the same low-turn category.
- Re-measure at 90 days. A single quarter is usually enough to see the shift in sales/sq ft on a reset section.
Department-Level Space Productivity
| Department | Gross Margin | Space Efficiency Pattern |
|---|---|---|
| Deli/Prepared Foods | 55%–65% | High revenue density on small footprint — chronically under-spaced relative to margin contribution |
| Center-Store Packaged Goods | 15%–25% | Low margin, 40%–50% of store footprint — the largest space-to-profit mismatch in a conventional layout |
| Produce | 35%–45% | Moderate density, high shrink offset — justifies prime placement for traffic + margin |
| Pharmacy | Thin (2%–4% net) | Very high revenue per sq ft in a small counter |
| Checkout/Front-End | Was a pure cost center | Now retail-media surface — fastest-growing profit-per-sq-ft category in the store |
Sourced insight: pharmacy’s margin percentage looks unimpressive next to deli, but a 200–400 sq ft pharmacy counter processes transaction volume that can rival an entire aisle — industry pharmacy leadership describes the department’s strategic value as extending “well beyond the direct revenue or margin it generates” because it functions as a recurring trip driver (Progressive Grocer, 2026).
Case Study: Reallocating 200 Sq Ft from Center-Store to Deli and Retail Media
The following is an illustrative model built from the benchmark ranges cited throughout this article, not a single named retailer’s audited results. Substitute your own store’s actual revenue and margin data before using this for a real decision.
A 200 sq ft section of slow-moving center-store packaged goods (specialty condiments, ethnic food overflow) is generating $350/sq ft/year at a 20% gross margin — a GMROI around 1.0, right at breakeven on the capital tied up in that inventory.
| Metric | Before (Center-Store) | After: Half to Deli Expansion, Half to Retail Media Screen |
|---|---|---|
| Space allocated | 200 sq ft | 100 sq ft deli / 100 sq ft checkout-adjacent retail media |
| Annual revenue at old rate | $70,000 (200 × $350) | — |
| Deli expansion revenue (100 sq ft at $700/sq ft, mid-range deli productivity) | — | $70,000 |
| Deli gross margin (55%–65% range, using 58%) | $14,000 gross profit | $40,600 gross profit |
| Retail media revenue (100 sq ft repurposed as ad-supported digital shelf/checkout screens, conservative estimate at $150/sq ft ad revenue) | — | $15,000 |
| Retail media margin (50%–75% range, using 60%) | — | $9,000 gross profit |
| Total gross profit from the 200 sq ft | $14,000 | $49,600 |
| Net change | — | +$35,600 (+254%) |
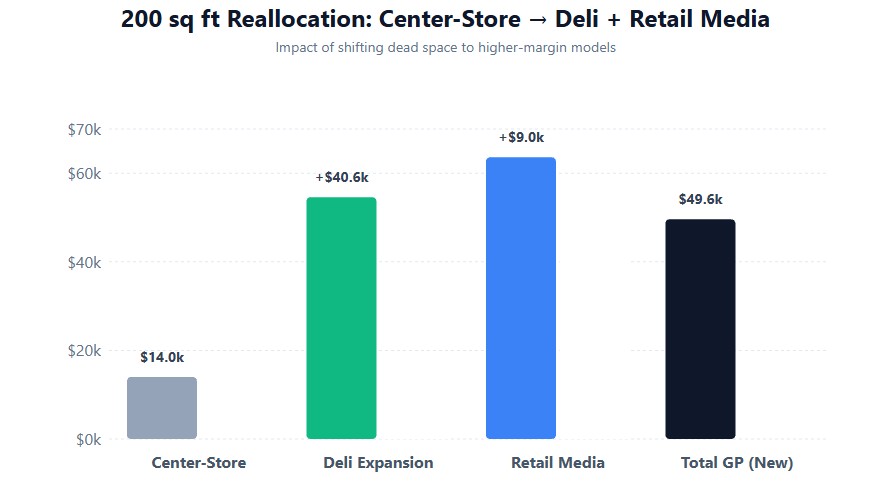
The mechanics: center-store packaged goods at 20% margin needs enormous velocity to compete with a department running 55%–65% gross margin (deli, per the department margin table above), and retail media inventory needs almost no velocity at all because it monetizes attention, not product turnover, at 50%–75% operating margin (Kroger and Walmart investor disclosures). The reallocation doesn’t require selling more product — it requires putting the same square footage to work in a business model with a structurally higher margin ceiling.
How to Calculate Grocery Order Contribution Margin (In-Store vs. Online)
Formula: Contribution per order = (Basket $ × gross margin %) − fulfillment cost per order
| Metric | In-Store | Online | Source |
|---|---|---|---|
| Average transaction value | $49.06 | $106 | FMI, 2025 |
| Fulfillment cost per order | Near-zero incremental | $10–$20 (grocery-specific, store-pick/delivery) | Walton College working paper (Young 2023; Boyer et al. 2004); last-mile delivery cost research, 2026 |
| Online item sales share | — | 8.9% of grocery item sales (2025) | FMI, 2025 |
Worked example at a 26% blended gross margin:
- In-store: $49.06 × 0.26 = $12.76 gross profit, fulfillment cost ≈ $0 → contribution ≈ $12.76
- Online: $106 × 0.26 = $27.56 gross profit, minus $10–$20 fulfillment → contribution = $7.56–$17.56
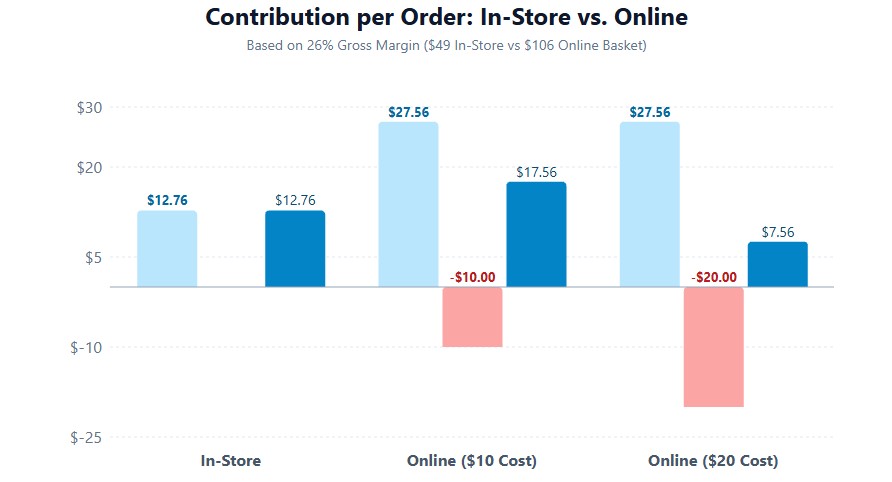
Red line: if your average online fulfillment cost exceeds $27.56 on a 26%-margin, $106 basket, that channel is running a net loss per order before even accounting for failed-delivery write-offs on perishables — and perishable failures are typically a total loss, not a redelivery.
If online contribution is negative, do this:
- Segment by fulfillment method — pickup and delivery have different cost structures and shouldn’t be averaged together (see the BOPIS vs. delivery section below).
- Set a minimum online basket size that clears fulfillment cost at your actual gross margin — publish it as a free-delivery/pickup threshold rather than eating the loss silently.
- Push high-margin substitution-friendly categories (deli, bakery) into the online assortment; they carry more margin per pick-minute than center-store staples.
- Re-run the math quarterly — fulfillment cost per order should fall as pick density per store increases; if it isn’t falling, the channel isn’t scaling.
Self-Checkout Shrink Rate: 2026 Benchmark (ECR Retail Loss Data)
Self-checkout now processes 33% of supermarket transactions industry-wide (FMI, 2025), with 54% of transactions flowing through self-checkout at the 39 retailers studied in the most comprehensive shrink audit to date (ECR Retail Loss, Self-Checkout Loss Report 2026, Prof. Matt Hopkins, University of Leicester). To understand the broader impact on your bottom line, review our guide on shrinkage in grocery stores and how to reduce it.
Correction to the widely-repeated “16x” figure: there is no traceable primary source for a 16x shrink multiplier at self-checkout. The credible, sourced numbers from ECR’s 2026 study (39 retailers, $1.16 trillion combined turnover) are:
| Measurement | Finding | Source |
|---|---|---|
| Average shrink increase, first 12 months after SCO installation | +22% | ECR Retail Loss 2026 |
| Average loss differential, SCO stores vs. comparable non-SCO stores | +33% | ECR Retail Loss 2026 |
| Percentage-point difference in loss rate, with vs. without SCO | +0.42 pts | ECR Retail Loss 2026 |
| Basis-point rule of thumb (Fixed SCO) | ~1 basis point of added shrink per 1% of transaction share on fixed SCO | ECR Shrink Group research |
| Loss impact at 55%–60% fixed-SCO transaction share | ~31% higher shrinkage than stores without SCO | ECR Shrink Group research |
Worked example: a store with a 1.5% baseline shrink rate that pushes 55%–60% of transactions through fixed self-checkout should budget for shrink closer to ~2.0% of sales, not a multiple of the baseline — a real and material margin hit at grocery volume, but nowhere near a “16x” headline.
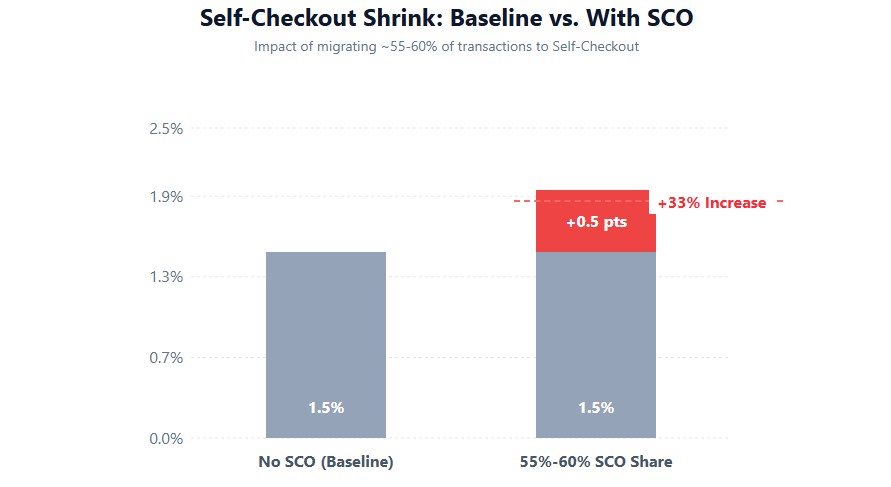
Red line: if your measured shrink increase after SCO rollout exceeds the 22%–33% range above, something is structurally different at your lanes (produce PLU misuse, no weight-verification, insufficient attendant coverage) and needs a targeted fix rather than a broader self-checkout rollback.
If shrink exceeds the benchmark, do this:
- Add weight-verification or AI vision scan-assist on produce and bulk lanes first — these categories drive a disproportionate share of SCO loss.
- Staff one attendant per 6–8 lanes minimum during peak hours; unattended lane ratios above this correlate with the top end of ECR’s loss range.
- Run partial-audit rescans — ECR found these catch errors in only ~2.88% of baskets vs. 43.4% for full audits, so partial audits alone are not a sufficient control.
- Track loss by lane type (fixed SCO vs. staffed) monthly, not annually — the 2026 ECR data is a before/after and with/without comparison; you need the same comparison at your own stores to know if you’re inside or outside the benchmark range.
How to Calculate Sales per Labor Hour in a Grocery Store
Formula: Sales per labor hour = Total department sales ÷ total labor hours
Benchmark: $217.83 industry-wide (FMI Food Industry Facts, 2025) — treat this as a store-wide baseline, not a per-department target (see below for why).
| Department | Labor as % of Dept. Sales | Pattern |
|---|---|---|
| Deli/Prepared Foods | 40%–50% | Labor-intensive; high gross margin offsets low sales/labor-hour |
| Center-Store | 2%–4% | Shelf-stable, low-touch; highest sales/labor-hour in the store |
| Produce | 8%–12% | Moderate labor draw from trimming, misting, culling shrink |
| Self-checkout front-end | N/A (1 attendant per 4–8 lanes) | Highest sales/labor-hour by design |
Red line: comparing a department’s sales/labor-hour directly against the $217.83 store-wide average without normalizing for gross margin %.
If a department looks “underperforming” on this metric, do this before cutting labor:
- Multiply sales/labor-hour by the department’s gross margin % to get margin dollars per labor hour — this is the number that’s actually comparable across departments.
- Compare that adjusted figure across departments, not the raw sales/labor-hour number.
- Only reduce headcount if margin-dollars-per-labor-hour is falling over time within the same department — not because it’s structurally lower than center-store’s.
GMROI Formula for Grocery: Benchmark and SKU Rationalization Rule
Formula: GMROI = Gross Margin $ ÷ Average Inventory Cost
Benchmark: Grocery runs 1.2–2.0 — structurally lower than general retail’s 2.0–3.0+ target because the model runs on thin margin compensated by very fast turnover (GMROI category benchmarking guides, SPS Commerce, 2026). For more details on optimizing this metric, read about the grocery store inventory turnover ratio.
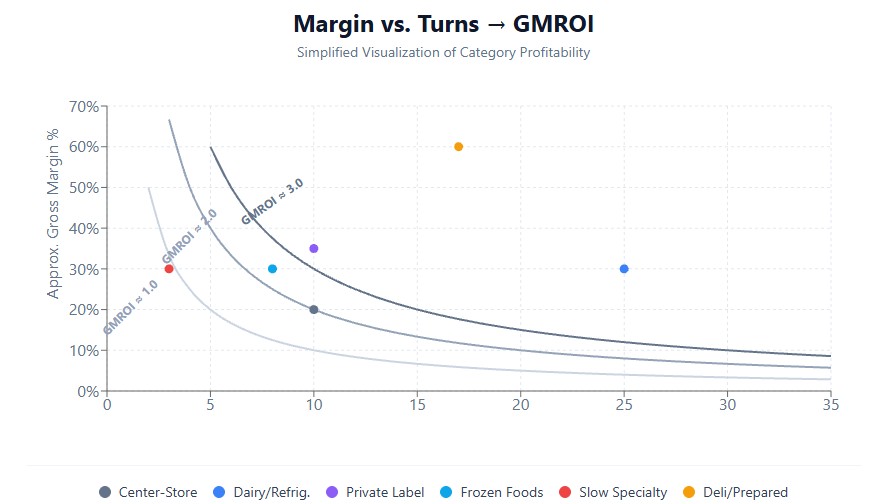
Red line: GMROI below 1.0 — you’re generating less than $1 of gross margin per $1 tied up in inventory, meaning the SKU or category is a net drag on working capital regardless of what its margin percentage looks like on its own.
| Category | Gross Margin | Approx. Turns/Year | Approx. GMROI | Read |
|---|---|---|---|---|
| Center-Store Packaged Goods | 15%–25% | 8–12x | ~1.2–2.5 | Margin-light, turn-heavy — grocery’s default engine |
| Dairy/Refrigerated | 25%–35% | 20–30x | ~2.0–3.5 | Fast turns (short shelf life forces it) compensate for moderate margin |
| Private Label (blended) | 30%–40% | Comparable to national-brand equivalent | 20%–40% higher GMROI than the national-brand SKU it replaces | The GMROI case for private label is stronger than the margin case alone |
| Frozen Foods | 25%–35% | 6–10x | ~1.5–2.2 | Slower turns than dairy, offset by lower shrink |
| Slow-moving specialty center-store | 25%–35% | 2–4x | Often below 1.0 | Classic SKU-rationalization candidate despite “good” margin % |
If GMROI is below 1.0, do this (in order):
- Check turns first, not margin — a GMROI under 1.0 is almost always a turnover problem, not a pricing problem.
- Cut order quantity/frequency before cutting the SKU entirely; sometimes the fix is smaller, more frequent orders rather than delisting.
- If turns don’t improve within one full inventory cycle, delist and reallocate the shelf space to a category already clearing 2.0+ GMROI.
- Recalculate GMROI quarterly, not annually — seasonal categories can look permanently unhealthy if measured at the wrong time of year.
Grocery Profit Centers Ranked by Margin: Pharmacy, Fuel, Retail Media, Private Label
| Business Line | Operating/Net Margin | Source |
|---|---|---|
| Retail Media (ads sold to CPG brands) | 50%–75% operating margin | Kroger Precision Marketing / Walmart Connect investor disclosures; Kroger Q1 FY2026 results |
| Fuel Centers | Near-zero gross margin on the pump; described by Kroger as “one of the great loyalty mechanics” rather than a profit line | Grocery Dive, 2026 |
| Pharmacy | 2%–4% net | Industry pharmacy-economics benchmarks; Progressive Grocer, 2026 |
| Deli/Prepared Foods | 55%–65% gross, compressed materially at net by 40%–50% labor draw | Category margin structure (industry benchmarks) |
| Private Label (blended) | 30%–40% gross vs. ~26% national brand | PLMA industry benchmarks |
| Center-Store (national brands) | 15%–25% gross | Category margin structure (industry benchmarks) |
| Online/Delivery (store-pick) | Frequently negative to breakeven after fulfillment cost | Last-mile delivery cost research, 2026 |
| Membership Fees (warehouse format only) | ~90%+ margin, near-pure profit | Costco 10-Q/10-K disclosures — Costco Q1 FY2026 10-Q |
Sourced insight on fuel: Kroger explicitly frames fuel as a loyalty mechanic rather than a standalone profit center — “fuel is one of the great loyalty mechanics,” per Kroger fuel strategy commentary (Grocery Dive, 2026) — while other operators have reached the opposite conclusion: Giant Eagle and Schnuck Markets both exited the fueling business, judging that the loyalty value didn’t clear the operating complexity and capital cost of running fuel centers. Evaluate your fuel center on incremental grocery-trip frequency it drives, not on pump margin alone, before deciding whether it’s worth keeping. For operators looking to boost margins through proprietary brands, check out our private label grocery strategy playbook.
Retail Media Margins in Grocery: 2026 Benchmark
| Metric | Value | Source |
|---|---|---|
| Operating margin, retail media ad sales | 50%–75% | Kroger/Walmart investor disclosures |
| Operating margin, food sales | 1.5%–2.5% | FMI, 2025 |
| Kroger Precision Marketing growth | 20%+ YoY (Q1 FY2026) | Kroger investor relations, 2026 |
| Walmart Connect revenue | $6.4 billion (2025) | Walmart 10-K disclosures |
Reframing self-checkout capex: a self-checkout screen occupies 1–2 sq ft and, evaluated purely as checkout infrastructure, is a labor-cost line. Evaluated as retail-media inventory sold to a CPG brand at 50%+ margin, that same footprint can be the single highest gross-margin-per-square-foot placement in the store. This changes the ROI case for self-checkout capex from “labor savings alone” to “labor savings plus ad inventory” — the second case usually clears payback thresholds the first one doesn’t.
Micro-Fulfillment Center ROI: Order Density Thresholds for 2026
In November 2025, Kroger took a $2.6 billion write-down and closed several large, centralized automated fulfillment centers after order density failed to reach the level needed for payback. Over the same period, Walmart — running a store-fulfillment model instead — now delivers 35% of store-fulfilled orders in under three hours using existing store square footage rather than standalone mega-facilities (industry fulfillment strategy analysis, 2026). Before investing in such infrastructure, ensure you have completed a thorough grocery store business plan and understand how much it costs to open a grocery store with these advanced features.
MFC Break-Even by Order Volume (2026 Cost Benchmarks)
| Facility Type | Capital Cost | Cost per Order at Maturity | Order-Density Threshold for Payback |
|---|---|---|---|
| Manual store-pick (no automation) | Minimal capex | $6–$10/order | No threshold, but doesn’t scale efficiently |
| In-store semi-automated MFC | $500K–$3M | $1–$3/order at maturity | 500+ orders/day: 3–4 yr payback. 1,000+ orders/day: 18–24 month payback |
| Standalone automated MFC (full robotics) | $5M–$10M+ | Lower still per order | Not viable below ~300–500 orders/day sustained |
| Dark store (converted retail, human pickers) | Low conversion cost; rent runs 3–4x standard retail/sq ft | Varies with basket size | Positive contribution above ~500 orders/day and $40+ average basket |
Sources: Microfulfillment cost and ROI industry benchmarks, 2026 (Fulfill.com, Microfulfillment.ai, Locus.sh); Kroger fulfillment center closure reporting, late 2025.
How to Estimate Your DMA’s Break-Even Order Volume (4 Steps)
- Count your current online order volume per store per day. If you’re not already running online orders at a meaningful volume, an MFC is premature regardless of density — build volume through manual store-pick and a third-party platform first.
- Multiply by your population density tier. Dense urban stores (multiple options within a 10-minute drive, high apartment density) can plausibly reach the 500–1,000/day range needed for a mid-tier in-store MFC. Suburban and rural stores rarely clear 300/day without years of demand-building — India’s dark-store market, for comparison, clusters over 3,800 of its 6,000+ dark stores in just the top eight cities, which is the clearest evidence that this model is a density problem before it’s a technology problem.
- Check your average online basket against the $40 threshold. Below $40, even a dense market may not generate positive contribution margin per order once fulfillment cost is subtracted.
- If you’re not within striking distance of 300–500 orders/day and a $40 basket, don’t build proprietary fulfillment infrastructure in 2026. Use manual store-pick (budget $6–$10/order as a customer-acquisition cost, not a profit line) or a third-party delivery platform, and revisit the MFC decision only after online volume crosses the threshold organically. Use our break-even analysis tools to model these scenarios.
BOPIS vs. Delivery: Which Has Better Grocery Unit Economics in 2026?
Pickup (BOPIS/click-and-collect) now represents a larger share of online grocery orders than same-day delivery — 31% to 29% — and is forecast to reach 50.3% of online grocery sales by 2027 (grocery fulfillment industry analysis, 2026). The reason is pure unit economics: no delivery fee for the shopper, and the operator avoids the last-mile leg that makes delivery structurally unprofitable at low density. 75% of BOPIS customers make additional in-store purchases at pickup — meaning pickup, unlike delivery, can add incremental in-store basket rather than only substituting for one.
For independent operators evaluating online investment in 2026: build pickup infrastructure (staging cooler, dedicated parking, order-ready notifications) before building delivery capacity. It costs a fraction of a delivery fleet or MFC and is the fulfillment method actually gaining share.
Grocery Loyalty Program ROI: Basket Lift Benchmarks by Source
| Source | Basket/Spend Lift, Members vs. Non-Members |
|---|---|
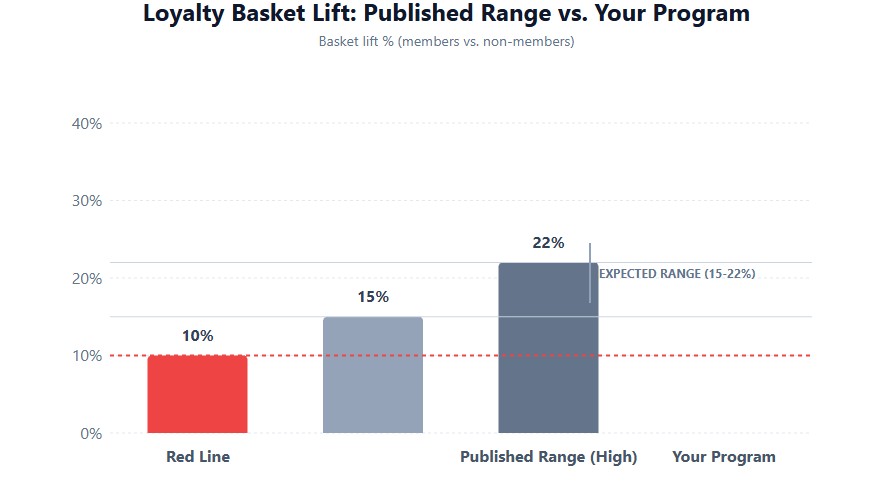
| Published grocery loyalty program analyses (aggregate) | 15%–22% higher basket size |
| Industry-wide loyalty cardholder benchmark | 20%–30% higher annual spend |
| Independent grocer case study (Vori / The Market at Edgewood) | 37% more frequent visits, ~$20 more per basket |
Caveat with a source, not a guess: as loyalty enrollment climbs industry-wide, incremental influence per member is declining according to 2026 transaction-data analysis — programs still shape which items a shopper buys and when they visit, but growing total spend has become a harder lever as nearly every chain now runs a comparable program (Upside, 2026). FMI’s 2026 Shopper Trends data reinforces this: households now shop 5.4 different grocery banners a month (6.7 for Gen Z, 6.1 for Millennials) — loyalty programs increasingly compete with each other for share of wallet rather than locking anyone in.
Red line: basket lift under 10%, below the low end of the published 15%–22% range — if your program isn’t clearing this after 12 months, the mechanics (redemption thresholds, personalization, digital engagement) need review before adding more members.
90-Day Action Plan to Increase Center-Store Sales per Square Foot
This is a sequence, not a menu — each step depends on data from the one before it.
| Days | Action | Metric to Check |
|---|---|---|
| 1–15 | Pull 12-month sales and margin by linear foot for center-store; calculate GMROI per category using the formula above | Identify categories below 1.0 GMROI |
| 16–30 | Cross-reference low-GMROI categories against loyalty-card purchase data (if available) to separate “genuinely low-demand” from “priced wrong” | Categories where price, not demand, is the issue get a pricing test instead of a delist |
| 31–45 | Delist the bottom 10%–15% of SKUs by GMROI in the worst-performing categories; reduce facings on borderline SKUs rather than delisting outright | Track weekly sell-through on remaining SKUs in the reset section |
| 46–60 | Reallocate freed linear footage to your top three GMROI performers or to an underspaced high-margin department (deli, bakery expansion, retail media placement) | Sales/sq ft on the reset section, week over week |
| 61–90 | Re-measure sales/sq ft and GMROI on the reset section against the pre-reset baseline; adjust facings again based on actual sell-through, not projections | Target: 8%–12% sales/sq ft improvement on the reset footage is a realistic 90-day outcome based on the mechanics above — treat anything claimed above 20% in 90 days with skepticism absent your own verified data |