According to the U.S. Census Bureau, tens of thousands of retail food and grocery business applications are filed annually, but independent grocery stores face one of the narrowest operational error margins in retail. With industry-wide net profit margins averaging just 1.5% to 3.5%, the gap between an idea and a funded grocery store is determined by the financial model. Lenders and underwriters do not evaluate grocery plans on general retail enthusiasm; they check category-level gross margins, shrinkage/spoilage assumptions, sales per square foot, and 24/7 refrigeration utility loads.
This guide adapts every section specifically for an independent grocery store, neighborhood market, or specialty food retailer. It includes grocery-specific unit economics, a complete in-text financial model, an itemized store equipment setup budget, an SBA-compliant DSCR calculation, and a full sample plan excerpt.
Table of Contents
- Fact-Check: Retail & Grocery Business Plan Statistics
- Step 1: Match the Plan Format to the Reader
- Step 2: Anatomy of a Lender-Ready Grocery Business Plan
- Step 3: The Grocery Store Financial Model Framework
- Step 4: Grocery Business Plan Template & Sample Excerpt
- Step 5: Business Plan vs. Pitch Deck for Grocery Retail
- Step 6: Requirements by Funding Source
- Step 7: Mistakes That Kill Otherwise-Fundable Grocery Plans
- Step 8: Grocery Retail Software & Benchmarks (2026)
- Step 9: Grocery Case Studies — What Went Wrong
- Step 10: Risk Matrix & Grocery Industry Shift (2026–2028)
- Frequently Asked Questions (FAQ / PAA)
Fact-Check: Retail & Grocery Business Plan Statistics
Before pitching lenders or investors, eliminate recycled retail statistics that do not hold up under underwriting scrutiny.
| Claim (as commonly cited) | Verifiable? | What the Traceable Industry Data Shows |
|---|---|---|
| “Grocery stores need 50% gross margins to survive” | False. Unsupported by industry financial data. | National Grocers Association (NGA) benchmarks show independent grocers operate at 24%–28% blended gross margins. Attempting to price for 50% gross margins destroys competitive foot traffic against regional chains. |
| “90% of independent grocery stores fail in Year 1” | False. Misquoted survivorship stat. | BLS data shows food and beverage stores have a ~20% failure rate in Year 1. The main killer of Year 2–3 grocers is unmanaged inventory shrinkage and working capital exhaustion during initial supplier COD terms. |
| “Online grocery delivery eliminates physical store space needs” | Outdated. Pre-2023 pandemic anomaly. | Over 80% of independent grocery sales remain in-store. Omnichannel micro-fulfillment adds 12%–18% in labor/pick costs, requiring physical store foot traffic to offset order fulfillment overhead. |
Step 1: Match the Plan Format to the Reader
Sending a 30-page full business plan to an angel investor, or a 10-slide pitch deck to an SBA commercial lender, leads to fast rejections. Match your document to the audience.
| Format | Length | Best For | What the Reader Checks First | Typical Review Time |
|---|---|---|---|---|
| SBA / Bank Loan Plan | 20–30 pages + Financial Package | SBA 7(a), SBA 504 (real estate/equipment), commercial bank loans | DSCR (≥1.15x), cold-storage CapEx breakdown, lease terms (5–10 yr required), store manager track record | 20–45 min (spread across underwriting) |
| Specialty / Co-op Deck | 10–15 slides | Local angel investors, community co-op boards, landlord pitch | Foot traffic per day, trade-area demographics, revenue/sq ft, differentiation vs. chain stores | Under 4 minutes |
| Lean Operating Plan | 2–3 pages | Internal store manager, department leads, inventory planners | Category turnover rates, target shrinkage limits (<2.5%), weekly labor budget | Reviewed weekly/monthly |
Step 2: Anatomy of a Lender-Ready Grocery Business Plan
A fundable grocery business plan requires nine specific sections with hyper-local data.
| Section | Purpose | Ideal Length | Grocery-Specific Failure Point |
|---|---|---|---|
| 1. Executive Summary | Synthesis of the retail concept, trade area, and loan ask | 1 page | Omits store square footage, daily foot traffic targets, and exact DSCR numbers. |
| 2. Company Description | Legal entity, ownership structure, physical site specs | 1 page | Fails to show a executed lease or Letter of Intent (LOI) with at least 5 years remaining (SBA requirement for buildout loans). |
| 3. Market Analysis | Local trade area, primary demographic radius (1–3 miles) | 3–4 pages | Citing national grocery market growth instead of actual household counts and median income within a 5-minute drive time. |
| 4. Organization & Management | Store manager, department heads, inventory team | 1–2 pages | Hiring a founder with no direct grocery management or perishables inventory experience without an experienced General Manager on staff. |
| 5. Products & Merchandising | Department mix, pricing strategy, supplier network | 2–3 pages | Listing products without specifying department margin targets (e.g., Produce vs. Dry Grocery). |
| 6. Marketing & Sales Strategy | Local foot-traffic acquisition, grand opening, loyalty app | 2 pages | Allocating budget to generic digital ads instead of physical direct mail flyers within a 1.5-mile radius and local grand opening promotions. |
| 7. Equipment & Use of Funds | Itemized allocation for refrigeration, POS, inventory | 1–2 pages | Listing “Store Buildout” as a single bulk sum instead of separating refrigeration units, POS systems, and initial stock. |
| 8. Financial Projections | 3-year P&L, Cash Flow, Balance Sheet, DSCR, Spoilage Model | 4–6 pages | Underestimating 24/7 commercial utility bills or assuming zero inventory shrinkage/spoilage. See also our Grocery Store Break-Even Analysis for profitability timelines. |
| 9. Appendix | Lease agreements, refrigeration vendor quotes, health permits | Varies | Missing health department preliminary approvals or equipment vendor quotes. |
Step 3: The Grocery Store Financial Model Framework
Grocery retail requires modeling departmental margins, spoilage rates, sales per square foot, and continuous cold-storage energy loads. For deeper analysis, review our guide on Grocery Store Unit Economics & Profit Centers.
[ Trade Area Foot Traffic ] ───> [ Sales / Sq Ft Build ]
                                         │
                                         ▼
                     [ Department-Level Margin Model ]
                     ├── Dry Goods (18-22% Gross Margin)
                     ├── Produce (32-38% Margin - High Shrink)
                     ├── Meat & Dairy (22-28% Margin)
                     └── Prepared Foods / Deli (45-55% Margin)
                                         │
                                         ▼
                     [ 3-Statement Grocery Financials ]
                     ├── Income Statement (P&L with Spoilage)
                     ├── Cash Flow (Inventory Working Capital)
                     └── Debt Service Coverage Ratio (DSCR)
Schedule 1: Grocery Unit Economics Framework
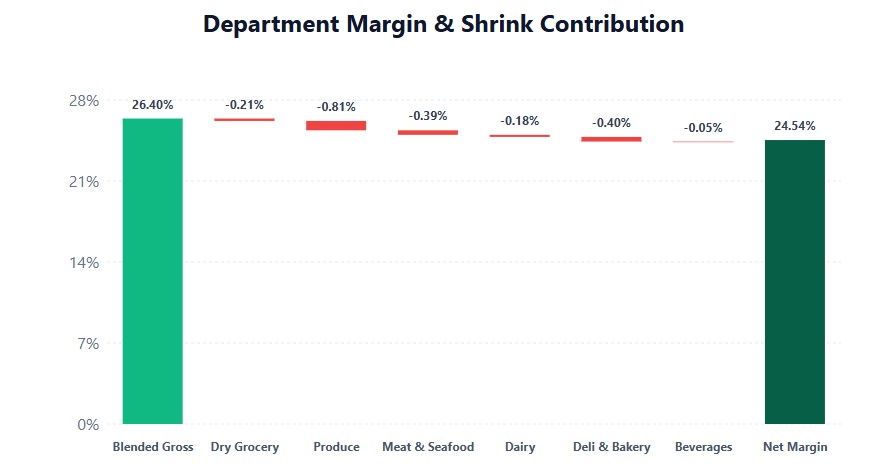
In grocery retail, unit economics are measured by Average Basket Size (AOV), Gross Margin by Department, and Sales per Square Foot.
Average Basket Size Formula:
Average Basket Size = Total Daily Grocery Sales ($) / Total Daily Customer Transactions
Blended Gross Margin Formula (Accounting for Shrinkage):
Blended Margin % = Σ (Dept Share % × Dept Margin %) – Shrinkage Rate %
Sales per Square Foot Benchmark Formula:
Sales / Sq Ft / Year = Annual Gross Revenue ($) / Total Retail Sales Floor Sq Ft
For category-level benchmarks, see our analysis of COGS for Grocery Stores.
Grocery Department Margin & Shrink Benchmark Table
| Department | Revenue Share (%) | Target Gross Margin (%) | Expected Shrink / Spoilage (%) | Net Margin Contribution |
|---|---|---|---|---|
| Dry Grocery & Pantry | 42% | 20.0% | 0.5% | 8.19% |
| Fresh Produce | 18% | 35.0% | 4.5% | 5.49% |
| Meat & Seafood | 15% | 26.0% | 3.0% | 3.45% |
| Dairy & Refrigerated | 12% | 22.0% | 1.5% | 2.46% |
| Prepared Deli & Bakery | 8% | 50.0% | 5.0% | 3.60% |
| Beverages & Frozen | 5% | 28.0% | 1.0% | 1.35% |
| BLENDED TOTALS | 100% | 26.4% | 2.0% (Average) | 24.54% Net Gross |
Schedule 2: Bottoms-Up Revenue Build (3,200 Sq Ft Store)
Instead of arbitrary top-down market share claims, calculate revenue from Daily Foot Traffic × Conversion × Basket Size.
Store Footprint: 3,200 Total Sq Ft (2,400 Sq Ft Retail Sales Floor / 800 Sq Ft Backroom & Walk-in Storage).
Operating Hours: 7 Days/Week (8:00 AM – 9:00 PM).
Year 1 Bottoms-Up Monthly Revenue Build (Quarterly Snapshot)
| Revenue Driver | Q1 (Mo 1-3 Avg) | Q2 (Mo 4-6 Avg) | Q3 (Mo 7-9 Avg) | Q4 (Mo 10-12 Avg) | Year 1 Total |
|---|---|---|---|---|---|
| Daily Store Foot Traffic (Walk-ins) | 280 / day | 360 / day | 420 / day | 480 / day | 139,500 total buyers |
| Conversion Rate (Paying Customers) | 85% | 88% | 90% | 92% | 88.75% avg |
| Daily Paying Transactions | 238 / day | 317 / day | 378 / day | 441 / day | 123,800 orders |
| Average Basket Size ($) | $28.50 | $31.00 | $33.50 | $35.00 | $32.25 avg |
| Monthly Gross Revenue ($) | $203,490 | $294,810 | $379,890 | $463,050 | $2,412,720 |
| Annual Sales / Sq Ft (Sales Floor) | — | — | — | — | $1,005 / Sq Ft |
Schedule 3: Pro Forma 3-Statement Grocery Model
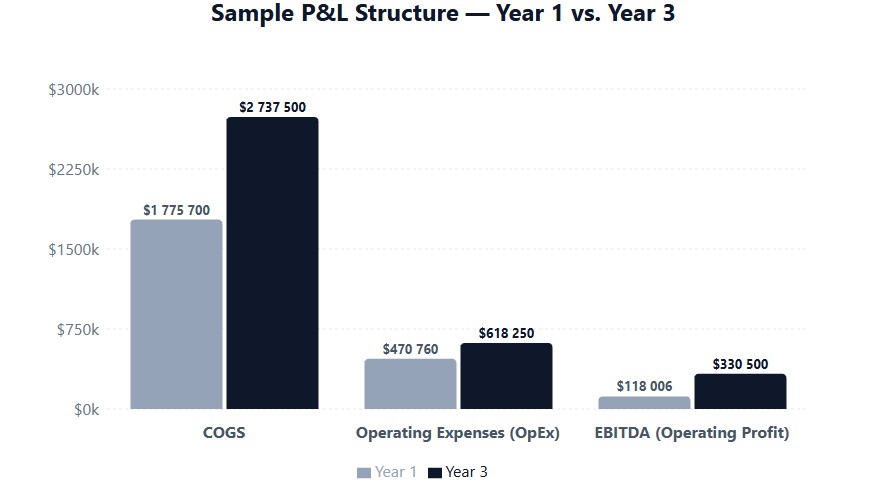
A. Pro Forma Income Statement (P&L Summary)
| Line Item | Year 1 ($) | Year 1 (%) | Year 2 ($) | Year 3 ($) |
|---|---|---|---|---|
| Gross Grocery Sales | $2,412,720 | 100.0% | $3,100,000 | $3,750,000 |
| Less: Spoilage, Shrinkage & Theft | ($48,254) | 2.0% | ($55,800) | ($63,750) |
| Net Revenue | $2,364,466 | 98.0% | $3,044,200 | $3,686,250 |
| Direct Cost of Goods Sold (COGS) | $1,775,700 | 73.6% | $2,263,000 | $2,737,500 |
| Gross Profit | $588,766 | 24.4% | $781,200 | $948,750 |
| Operating Expenses (OpEx): | ||||
| Store Payroll (Manager, Cashiers, Stockers) | $210,000 | 8.7% | $260,000 | $300,000 |
| Rent (3,200 sq ft @ $38/sq ft NNN) | $121,600 | 5.0% | $125,240 | $129,000 |
| Commercial Utilities (Refrigeration 24/7) | $42,000 | 1.7% | $45,000 | $48,000 |
| Merchant Credit Card Fees (2.1% blended) | $50,660 | 2.1% | $65,100 | $78,750 |
| Insurance, Permits & Pest Control | $16,500 | 0.7% | $18,000 | $19,500 |
| Local Direct Mail & Loyalty Marketing | $18,000 | 0.7% | $22,000 | $25,000 |
| Packaging, Bags & POS Supplies | $12,000 | 0.5% | $15,000 | $18,000 |
| Total Operating Expenses | $470,760 | 19.5% | $550,340 | $618,250 |
| EBITDA | $118,006 | 4.9% | $230,860 | $330,500 |
| Depreciation (Refrigeration & Fixtures) | $22,500 | 0.9% | $22,500 | $22,500 |
| Operating Income (EBIT) | $95,506 | 4.0% | $208,360 | $308,000 |
| SBA Debt Interest Expense ($400k loan) | $39,200 | 1.6% | $34,800 | $30,100 |
| Net Profit Before Taxes | $56,306 | 2.3% | $173,560 | $277,900 |
B. Pro Forma Cash Flow Statement (Grocery Working Capital Drag)
Grocery store cash flows are heavily impacted by Initial Inventory Stocking and supplier payment terms. Distributors often demand Cash on Delivery (COD) for the first 90 days before granting Net-30 terms. Learn more about Grocery Store Cash Flow Management best practices.
| Cash Flow Category | Year 1 ($) | Year 2 ($) | Year 3 ($) |
|---|---|---|---|
| Operating Activities: | |||
| Net Income | $56,306 | $173,560 | $277,900 |
| + Depreciation (Non-Cash) | $22,500 | $22,500 | $22,500 |
| – Initial Inventory Purchase (Stocking) | ($85,000) | ($15,000) | ($18,000) |
| + Accounts Payable (Supplier Net-30 Leverage) | $32,000 | $12,000 | $14,000 |
| Net Cash from Operating Activities | $25,806 | $193,060 | $296,400 |
| Investing Activities: | |||
| Capital Expenditures (Refrigeration, POS, Buildout) | ($280,000) | ($15,000) | ($15,000) |
| Net Cash from Investing Activities | ($280,000) | ($15,000) | ($15,000) |
| Financing Activities: | |||
| Owner Equity Injection | $100,000 | $0 | $0 |
| SBA 7(a) Loan Proceeds | $400,000 | $0 | $0 |
| – Annual Debt Principal Amortization | ($26,000) | ($29,100) | ($32,500) |
| Net Cash from Financing Activities | $474,000 | ($29,100) | ($32,500) |
| Net Change in Cash | $219,806 | $148,960 | $248,900 |
| Ending Cash Reserve | $219,806 | $368,766 | $617,666 |
C. Debt Service Coverage Ratio (DSCR) for SBA Loan Underwriting
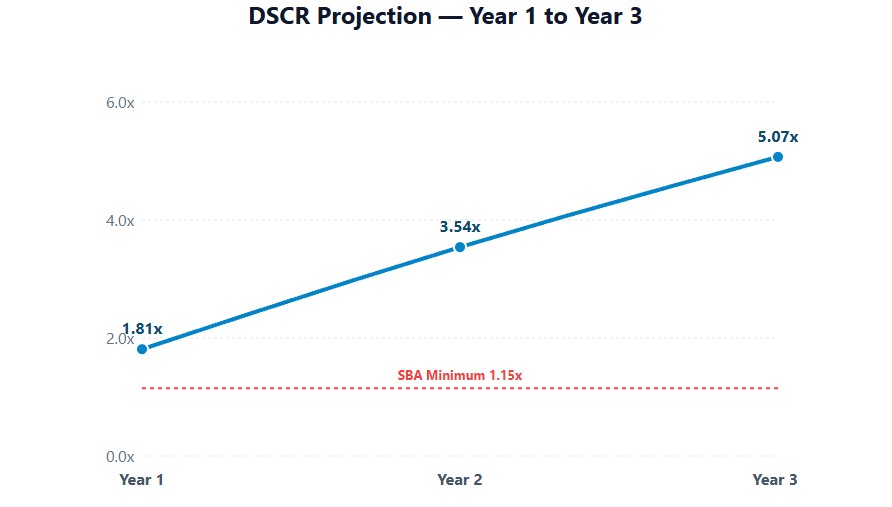
Under SBA SOP 50 10 8, underwriters require a minimum DSCR of 1.15x for retail food operations due to inventory risks.
Requested SBA Loan: $400,000 (10-Year Term, Estimated Rate: 10.25%).
Annual Debt Service (Principal + Interest): ~$65,200 / year.
DSCR Formula:
DSCR = Net Operating Income (EBITDA) / Annual Debt Service
Year 1 DSCR:
Year 1 DSCR = $118,006 / $65,200 = 1.81x (Clears SBA 1.15x requirement)
Year 2 DSCR:
Year 2 DSCR = $230,860 / $65,200 = 3.54x
Schedule 4: Grocery Sensitivity & Spoilage Stress Test
Sensitivity Matrix: Impact of Spoilage & Foot Traffic Fluctuations on Year 1
| Scenario | Daily Customers | Spoilage % | Year 1 EBITDA | Year 1 DSCR | Status |
|---|---|---|---|---|---|
| Base Case | 338 avg | 2.0% | $118,006 | 1.81x | Strong Approval |
| High Spoilage Stress | 338 avg | 4.5% | $57,700 | 0.88x | DEFEATED (DSCR < 1.15x) |
| Low Foot Traffic (-20%) | 270 avg | 2.0% | $76,200 | 1.17x | Marginal Approval |
| Severe Combined Downside | 270 avg | 3.5% | $39,800 | 0.61x | Loan Default Risk |
Step 4: Grocery Business Plan Template & Sample Excerpt
Part A: Grocery Store Business Plan Outline (Template)
1. EXECUTIVE SUMMARY
   1.1 Store Concept, Name & Value Proposition
   1.2 Target Neighborhood & Foot Traffic Projections
   1.3 Store Size & Sales Floor Layout
   1.4 Financing Request ($ Loan + $ Owner Equity)
   1.5 Financial Highlights & DSCR Proof

2. STORE DESCRIPTION & LOCATION
   2.1 Legal Structure & Ownership (20%+ Owners)
   2.2 Site Selection & Trade Area Radius (1–3 Miles)
   2.3 Lease Terms & Leasehold Improvements
   2.4 Health Department & Retail Food Licensing Status

3. MERCHANDISING & MARKET ANALYSIS
   3.1 Target Demographic Profile (Household Income, Density)
   3.2 Competitor Matrix (Chains vs. Independents vs. Bodegas)
   3.3 Department Mix & Sourcing Strategy (Local Distributors)
   3.4 Pricing Strategy & Margin Target Matrix

4. OPERATIONAL PLAN
   4.1 Daily Operating Schedule & Store Hours
   4.2 Cold-Storage & Refrigeration Maintenance Plan
   4.3 Inventory Management, Shrinkage & Spoilage Controls
   4.4 POS System, Integrated Scales & Merchant Processing

5. MANAGEMENT & STAFFING
   5.1 Store General Manager Track Record
   5.2 Staffing Plan (Department Heads, Cashiers, Stockers)
   5.3 Employee Training on Food Safety & Sanitation

6. MARKETING & LOCAL CUSTOMER ACQUISITION
   6.1 Grand Opening Promotion Plan
   6.2 Direct Mail & Radius Marketing Strategy
   6.3 Loyalty Program & Digital Weekly Circulars

7. ITEMIZATION OF CAPITAL EXPENSES & USE OF FUNDS
   7.1 Cold Storage & Refrigeration Equipment
   7.2 POS Hardware, Scales & Shelving
   7.3 Initial Opening Inventory Stock
   7.4 Working Capital Cash Reserve

8. FINANCIAL PLAN & PROJECTIONS
   8.1 Departmental Margin & Spoilage Assumptions
   8.2 3-Year Income Statement (P&L)
   8.3 3-Year Cash Flow Statement with Inventory Drag
   8.4 Pro Forma Balance Sheet
   8.5 SBA Debt Service Coverage Ratio (DSCR) Calculation
   8.6 Break-Even Analysis (Daily Basket Count)

9. APPENDIX
   9.1 Founder Personal Financial Statements (PFS) & Resumes
   9.2 Executed Commercial Lease or LOI
   9.3 Vendor Quotes for Refrigeration Units & POS
   9.4 Preliminary Health Department Compliance Approval
Part B: Real-World Grocery Business Plan Sample Excerpt
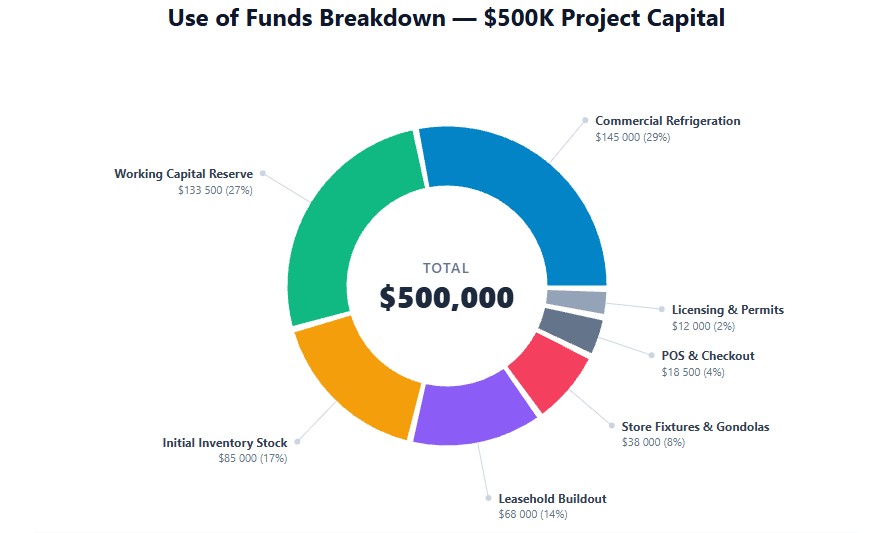
Below is a lender-ready sample excerpt for Greenfield Fresh Market LLC (an urban independent grocer).
Sample Section 1: Executive Summary Excerpt
Greenfield Fresh Market LLC is a 3,200 sq ft independent neighborhood grocery store located at 1420 N. High Street in the North Short North commercial corridor of Columbus, Ohio. The store fills a documented “fresh food gap” in a trade area containing 18,400 residents within a 1-mile radius, where the nearest full-service grocery chain is 2.2 miles away.
Core Concept: Greenfield Fresh Market provides everyday pantry staples, locally sourced produce, high-margin prepared deli items, and cold beverages. The store targets busy urban professionals and neighborhood families seeking rapid 15-minute shopping trips.
Financial Request: Greenfield Fresh Market is seeking a $400,000 SBA 7(a) loan paired with a $100,000 cash owner equity injection (total project capital: $500,000). Year 1 projected net sales of $2,364,466 generate an EBITDA of $118,006. This yields a 1.81x Debt Service Coverage Ratio (DSCR) against annual loan payments of $65,200, exceeding the SBA minimum threshold of 1.15x.
Sample Section 7: Itemized Use of Funds Excerpt
Below is the itemized budget for the $500,000 project capital:
| Expense Category | Item Description & Vendor Source | Total Cost ($) |
|---|---|---|
| Commercial Refrigeration | Walk-in Cooler (12’x16′), 4-Door Freezer Display, 12′ Open Produce Case (Bush Refrigeration Quote #8810) | $145,000 |
| POS & Checkout | 2x IT Retail Checkout Stations, Barcode Scanners, NTEP Certified Scales, Cash Drawers (IT Retail Quote #402) | $18,500 |
| Store Fixtures & Gondolas | Steel Gondola Shelving (300 ft), Produce Bins, Bakery Cases, Shopping Carts (Madix Fixtures) | $38,000 |
| Leasehold Buildout | Plumbing for prep sinks, upgraded 400A 3-phase electrical panel, commercial flooring (Commercial GC Estimate) | $68,000 |
| Initial Inventory Stock | Dry grocery, produce, dairy, frozen goods, beverages (UNFI & C&S Wholesale LOIs) | $85,000 |
| Licensing & Permits | Retail Food Establishment License, Health Dept Permit, Signage | $12,000 |
| Working Capital Reserve | 90-day payroll buffer and cash reserve for initial COD distributor terms | $133,500 |
| TOTAL PROJECT CAPITAL | $500,000 |
Step 5: Business Plan vs. Pitch Deck for Grocery Retail
- For Commercial Lenders (SBA/Banks): Lead with the Full 25-Page Narrative Business Plan. Underwriters need explicit documentation on inventory turn, store lease terms, equipment liens, and DSCR ratios. A pitch deck will not pass loan committee.
- For Real Estate Landlords: Provide a 5-Page Site Plan & Summary Deck. Landlords want to see sales/sq ft projections, foot-traffic estimates, retail experience, and proof of funds for leasehold improvements.
- For Angel Investors / Equity Partners: Lead with a 12-Slide Pitch Deck. Focus on community market gap, gross margins in prepared foods, scalable site expansion, and projected return on equity.
Step 6: Requirements by Funding Source
| Funding Source | Required Document Package | Primary Underwriting Focus | Collateral & Equity Required |
|---|---|---|---|
| SBA 7(a) Loan | Full Plan + 3-Yr Projections + DSCR Calc + Equipment Quotes | DSCR ≥ 1.15x, grocery management experience, clean credit (680+) | 10%–20% Equity Injection ($50k–$100k) + Equipment Lien. For application guidance, see How to Get a Small Business Loan for a Grocery Store in 2026. |
| SBA 504 Loan | Full Plan + Real Estate Appraisal + CapEx Breakdown | Fixed-asset financing (buying store building or major refrigeration) | 10% equity for existing, 15%–20% for startup stores |
| Local Community Bank | Full Plan + Lease Agreement + PFS | Personal guarantees, local trade-area knowledge, existing cash deposits | Store equipment liens + personal real estate equity |
| Grocery Co-op / Community Equity | Pitch Deck + Member Offering Memorandum | Community food access, local vendor sourcing, membership growth | Board approval + community subscription shares |
Step 7: Mistakes That Kill Otherwise-Fundable Grocery Plans
- Ignoring the Commercial Refrigeration Power Bill: Standard retail stores pay $1.50–$2.50/sq ft/year in energy. Grocery stores pay $4.00–$7.00/sq ft/year due to walk-in compressors operating 24/7. Omitting high utility assumptions causes lenders to reject OpEx budgets.
- Using Chain-Store Gross Margins: Assuming a single-store grocer can match Walmart or Kroger’s 70% COGS is fatal. Single-location grocers pay 5%–12% more for wholesale inventory. Your financial model must use independent wholesale distributor pricing (e.g., UNFI, C&S, KeHE).
- Lacking Spoilage / Shrink Controls: Assuming 0% inventory loss. Underwriters instantly flag plans that do not deduct 1.5%–3.0% for spoilage, cashier errors, and shoplifting. Review our full guide on Shrinkage in Grocery Stores and How to Reduce It.
- Misjudging Distributor Payment Terms: New grocers rarely receive Net-30 credit terms immediately. Wholesale food distributors require COD (Cash on Delivery) or weekly ACH auto-debits for the first 90–180 days, requiring a larger working capital reserve.
Step 8: Grocery Retail Software & Benchmarks (2026)
Lenders expect software systems tailored to food retail inventory and NTEP scale compliance.
| Software Category | Top Recommended Systems | Why It Matters to Lenders |
|---|---|---|
| Grocery POS & Inventory | IT Retail, Epos Now Grocery, LOC Software | Features integrated scale compliance, automated bottle-deposit tracking, EBT/SNAP payment processing, and real-time margin tracking. |
| Wholesale Sourcing Portals | UNFI, C&S Wholesale, KeHE, Mable | Direct integration into POS for automated wholesale price-change updates and electronic invoices. |
| Shrink & Waste Analytics | Afresh, FreshIQ (Wrapper) | Uses AI forecasting to reduce fresh produce spoilage by 10%–20%, protecting gross margins. |
Step 9: Grocery Case Studies — What Went Wrong
Case 1: The Spoilage Working Capital Trap (Independent Specialty Grocer)
What Happened: A new organic grocer stocked $90,000 in perishable inventory at launch. Due to lower-than-expected Year 1 Month 1 foot traffic, $18,000 in produce and dairy spoiled within 21 days. The store ran out of cash to place its next wholesale order.
Lesson: Start with a phased inventory launch. Stock dry goods fully, but scale fresh produce orders at 30% capacity during the first 30 days until foot traffic patterns normalize. For prevention strategies, see our guide on Grocery Store Inventory Turnover Ratio.
Case 2: The Equipment Lien & Lease Mismatch
What Happened: A founder signed a 3-year commercial lease for a store building. The SBA lender refused to fund the $200,000 refrigeration equipment loan because the SBA requires the lease term to match or exceed the 10-year loan repayment period.
Lesson: Secure a 5-year primary lease with a 5-year extension option before submitting an SBA application for grocery buildouts.
Step 10: Risk Matrix & Grocery Industry Shift (2026–2028)
Risk Matrix for Grocery Store Operators
| Risk Factor | Financial Impact | Likelihood | Mitigation Strategy |
|---|---|---|---|
| Refrigeration Compressor Breakdown | High ($10k–$30k product loss) | Medium | Install remote IoT temperature sensors; maintain $15k emergency equipment reserve fund. |
| Local Competitor Price War | Medium (Margin compression) | High | Shift store mix toward 20%+ prepared deli items and unique local items that big chains don’t carry. |
| Distributor COD Term Pressure | High (Cash flow freeze) | High | Reserve at least 30 days of working capital specifically for initial wholesale inventory ACH debits. For detailed strategies, see our guide on Buy vs. Lease Commercial Real Estate for a Grocery Store. |
Key Grocery Trends (2026–2028)
- EBT / SNAP Integration: Electronic Benefit Transfer processing is mandatory for neighborhood grocers. In urban markets, EBT accounts for 12%–25% of total store revenue.
- Prepared Foods Expansion: To combat thin 20% dry-grocery margins, modern independent grocers allocate 10%–15% of floor space to grab-and-go prepared meals, which carry 45%–55% gross margins.