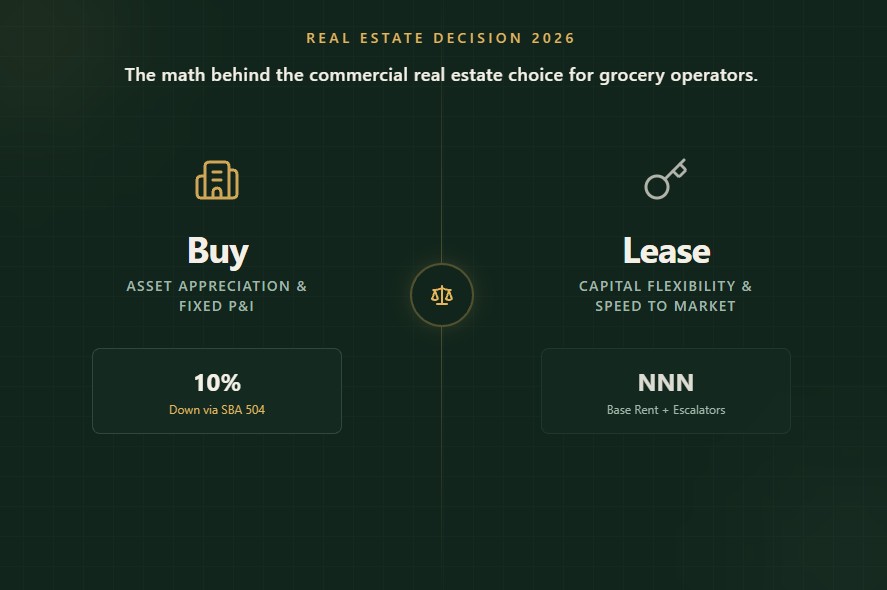
A 10% down payment through an SBA 504 loan can put you in the building for less upfront cash than a landlord’s security deposit and buildout-allowance shortfall on a comparable leased space — and CBRE counted $12.8 billion of grocery-anchored real estate investment in the four quarters ending Q1 2026, the highest institutional buyer preference of any retail category. [CBRE via Schuckman Realty, 2026] That single fact should reframe how any grocery operator thinks about this decision: you’re not choosing between “cheap” and “expensive.” You’re choosing whether to compete with Wall Street for the asset, or rent it from whoever already won that competition.
This is the decision most grocery cost guides skip entirely, treating real estate as a single line item (“rent: $18–$85/sq ft”) instead of a genuine capital-allocation choice with a 10-to-25-year time horizon. Below is the actual math, with the formulas shown and every figure sourced. For broader startup budgeting, see our guide to how much it costs to open a grocery store.
The Core Trade-Off in One Table
| Factor | Buy | Lease |
|---|---|---|
| Upfront capital | 10% down (SBA 504) to 20–35% down (conventional) | First/last month + security deposit (2–4 months rent) + your share of buildout |
| Monthly obligation | Fixed P&I for loan term (10–25 yrs) | Base rent + NNN (taxes, insurance, CAM), typically rising 2–3%/yr |
| Who pays for the roof/parking lot | You | Landlord, in most NNN structures (structural items stay with landlord unless the lease says otherwise) |
| Refrigeration & buildout capex | Yours, and it’s an asset on your balance sheet | Yours, but it becomes the landlord’s fixture at lease-end unless you negotiate removal/reimbursement rights |
| Upside if the location gets hot | You capture 100% of appreciation | Landlord captures it; you get a renewal notice with a higher rent |
| Downside if the location goes cold | You’re holding an illiquid, special-use asset | You can (eventually) walk at lease expiration |
| Relocation flexibility | Low — selling a special-use retail building takes months | Higher, but early termination penalties are steep for anchor-size spaces |
| Tax treatment | Depreciation (39-yr straight-line for nonresidential real property) + interest deduction + potential Section 1031 exchange on exit | Rent is a straight operating expense deduction, no depreciation benefit |
| Best fit | Operators committed 8–10+ years to one address, able to fund a real down payment without starving opening inventory | Operators testing a market, expanding fast, or capital-constrained in year 1–3 |
Commercial Building Purchase Costs: SBA 504 vs. Conventional Mortgage
The Financing Stack
Almost nobody pays cash for a grocery building. The two live paths in 2026 are SBA 504 and a conventional commercial mortgage, and the gap between them is the whole story.
| Financing Type | Down Payment | Structure | Rate (2026) | Term |
|---|---|---|---|---|
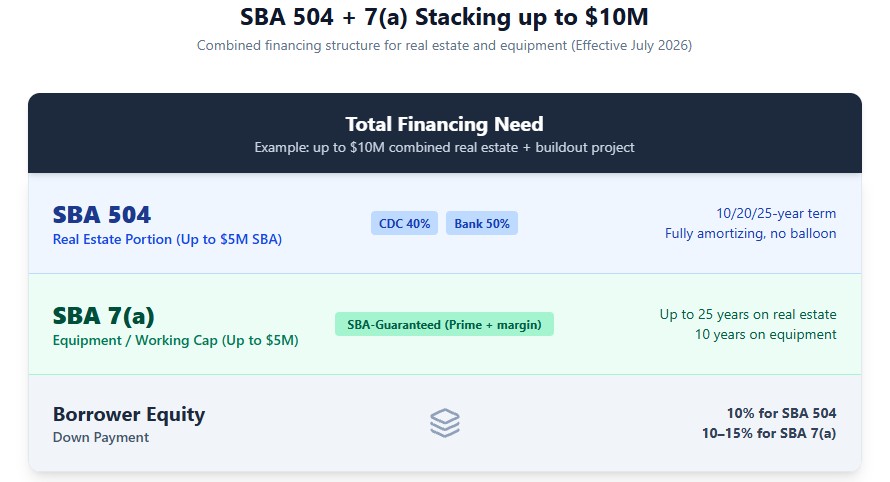
| SBA 504 | 10% (15–20% for startups or special-use property, which a grocery store with heavy refrigeration infrastructure typically is classified as) | Bank funds 50% (first lien), CDC/SBA funds 40% (second lien, debenture-priced), you fund 10% | CDC/debenture piece: 5.8%–6.3% fixed as of mid-2026; bank first-lien piece: 6.0%–7.0%; blended effective rate ~6.0%–6.5% | 10, 20, or 25 years, fully amortizing, no balloon. Verify current pricing with an SBA lender; SBA confirms that 504 provides long-term, fixed-rate financing for major fixed assets. [SBA.gov, 2026] |
| Conventional commercial mortgage | 20–35% (typically 25% for a qualified owner-occupied borrower) | Single bank loan | 6.0%–8.75%, commonly quoted 6.5%–7.5% for a stabilized owner-occupied deal | 5–20 years, often with a balloon and 25-year amortization schedule |
| SBA 7(a) (real estate portion) | 10–15% | Single SBA-guaranteed loan; can bundle real estate + equipment + working capital | Prime + margin, effectively 10–13% in 2026 depending on loan size | Up to 25 years on real estate |
The financing development that matters most for a grocery operator specifically: as of July 2026, qualified borrowers can stack a 504 loan with a 7(a) loan for up to $10 million in combined financing — meaning a real estate purchase and an equipment/refrigeration buildout can now be underwritten together instead of forcing two separate loan processes at two different rates. [U.S. Small Business Administration, July 2026] The individual 504 program cap remains $5 million ($5.5 million for manufacturers).
Worked Example: Financing a $1.2 Million Building
Assume a 4,000 sq ft, $1.2 million purchase price for an existing second-generation retail building already zoned for food use — a $300/sq ft price point consistent with a secondary-to-mid-tier metro.
| Line Item | SBA 504 Structure | Conventional Structure |
|---|---|---|
| Purchase price | $1,200,000 | $1,200,000 |
| Down payment | $120,000 (10%) | $300,000 (25%) |
| Loan amount financed | $1,080,000 (bank $600,000 at ~6.5% + CDC $480,000 at ~6.1%, blended ~6.3%) | $900,000 at ~7.0% |
| Amortization | 25 years | 25 years |
| Monthly P&I | ~$7,190 | ~$6,360 |
| Cash retained vs. the other structure | +$180,000 kept as working capital vs. conventional | Baseline |
The 504 structure costs roughly $830/month more than conventional at this size, but it frees up $180,000 in cash — which, for a grocery operator, is close to the entire initial inventory and equipment budget for a store this size. That’s the real trade: monthly cash flow versus opening-day liquidity, and for a business running 1.5–2.5% net margins, opening-day liquidity is usually the scarcer resource.
What the Building Itself Is Worth to Someone Else
Grocery-anchored real estate is trading at some of the tightest cap rates in retail, which tells you both the opportunity and the competition you’re up against as a buyer.
| Anchor Tier | 2026 Cap Rate Range | Source |
|---|---|---|
| Top-tier credit (Publix, Trader Joe’s) | 5.25%–5.8% for best-in-class, top-market centers | [Schuckman Realty citing market research, June 2026] |
| Stabilized institutional grocery-anchored | 5.5%–6.25% | [Schuckman Realty citing market research, May 2026] |
| Grocery-anchored national average | ~6.7%, compressed ~40 bps from the 2023 cycle peak | [JLL Grocery Tracker 2026, secondary presentation] |
| Single-tenant NNN grocery/big-box | 4.5%–6.0% | Market range; verify against current brokerage comparables and closed transactions |
| Open-air grocery-anchored (public REIT acquisitions, e.g. Brixmor, Kimco) | 6.0%–6.8% | Market range; verify against the applicable REIT’s current SEC filings and investor presentations |
The transaction-volume context: JLL’s Grocery Tracker put 2025 grocery-anchored transaction volume at roughly $11 billion, up about 42% year-over-year, with institutional buyer share at its highest level in more than a decade; CBRE separately counted $12.8 billion of grocery-anchored investment in the rolling four quarters ending Q1 2026, in a survey where 85% of institutional retail investors named grocery-anchored their top format preference. [JLL / CBRE data as reported by Schuckman Realty, June 2026] These are two different data providers measuring overlapping but not identical universes (JLL’s transaction tracker vs. CBRE’s rolling four-quarter count), so treat both as directional confirmation of the same trend rather than a single reconciled number.
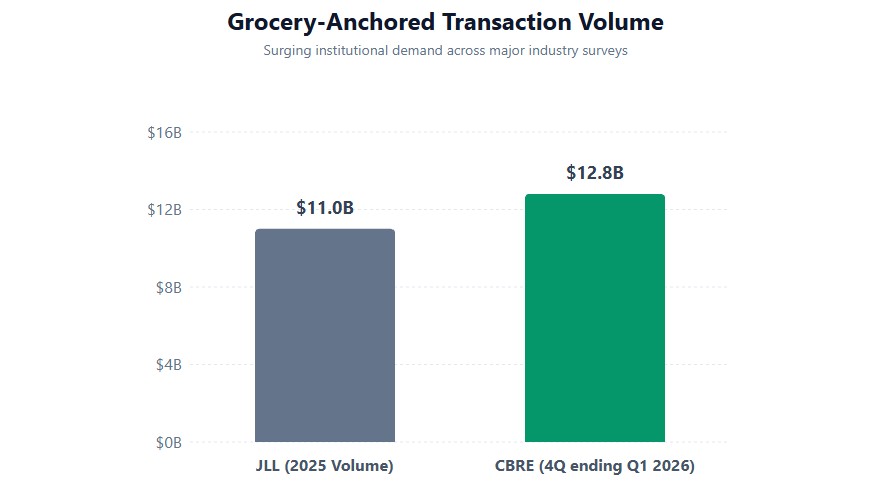
The practical implication: if you buy well and hold, you’re sitting on an asset class institutional capital is actively bidding up. If you buy in a thin secondary market, you’re the exit liquidity for nobody, because new retail construction is running well below its ten-year average and grocery-anchored product is, in the words of one active broker, “effectively fixed” in supply — a scarcity that protects owners in good locations and makes sourcing a lease-ready, food-service-equipped space harder for everyone else. [HB Capital, July 2026]
Grocery Store NNN Lease Rates & Occupancy Costs
The NNN Structure, Broken Down
Grocery anchors often sign triple-net (NNN) leases: base rent plus the tenant’s pro-rata share of property taxes, building insurance, and common-area maintenance (CAM). The exact allocation of structural repairs depends on the lease language; a tenant should not assume that roof, structure, or major systems automatically remain the landlord’s responsibility.
| Component | Major Metro (2026) | Secondary Metro (2026) |
|---|---|---|
| Base rent | $35–$50/sq ft | $18–$28/sq ft |
| Property taxes (pass-through) | $3–$5/sq ft | $1.50–$3/sq ft |
| Insurance (pass-through) | $1–$2/sq ft | $0.75–$1.50/sq ft |
| CAM | $3–$6/sq ft | $2–$4/sq ft |
| All-in occupancy cost | $42–$63/sq ft | $22–$37/sq ft |
| Annual escalator | 2–3% | 2–3% |
Ranges are planning estimates synthesized from cited 2026 retail-market data, not a national lease registry. Verify asking rent, expense stops, CAM exclusions, insurance requirements, and structural-repair language against the actual lease and local comparables.
For a 4,000 sq ft neighborhood grocery, that’s roughly $88,000–$252,000/year in occupancy cost depending on market, before a single markup is applied to a can of tomatoes.
The Anchor Leverage Most Operators Don’t Use
A supermarket isn’t just a tenant to a shopping-center landlord — it’s the traffic generator for every other store in the center. That gives a credible grocery operator leverage a boutique or QSR tenant doesn’t have, and it shows up in three negotiable terms operators routinely leave on the table:
- Co-tenancy clauses — your rent reduces, or you gain termination rights, if the center’s occupancy drops below a threshold.
- Exclusive-use clauses — the landlord can’t lease space to a competing grocery or specialty food tenant in the same center.
- Tenant improvement (TI) allowances — landlords will often fund $15–$40/sq ft of buildout for an anchor tenant specifically because the anchor de-risks leasing the rest of the center. On a 4,000 sq ft space, that’s $60,000–$160,000 of buildout potentially covered by the landlord instead of your capital.
- Percentage rent — common in mall and lifestyle-center leases — is comparatively rare for grocery anchors. At 1.5–2.5% net margins, a percentage-rent clause pegged to gross sales can consume your entire net profit in a strong sales year; check for this clause before signing and negotiate it out or cap it low.
The 10-Year Buy vs. Lease Financial Model
This is the comparison most guides never run because it requires committing to explicit formulas and assumptions. Here they are.
The Formulas
Remaining loan balance after t months, on a loan amount P, monthly rate r, and total term N months:
Remaining_Balance(t) = P × [(1+r)^N − (1+r)^t] / [(1+r)^N − 1]
Building value after t years, at appreciation rate g:
Building_Value(t) = Purchase_Price × (1 + g)^t
Equity at year t:
Equity(t) = Building_Value(t) − Remaining_Balance(t)
Cumulative lease cost through year t, on year-1 rent R₁ and escalator e:
Total_Lease_Cost(t) = Σ (from n=1 to t) of [ R₁ × (1+e)^(n−1) ]
Opportunity value of capital not spent on a larger down payment, where ΔC is the difference between the buy-side down payment and the lease-side deposit, invested at return k:
Opportunity_Value(t) = ΔC × (1 + k)^t
Net position compares what each path is worth as a standalone asset at year t: Equity(t) for buying, Opportunity_Value(t) for leasing. This isolates the wealth-building side of the decision; it does not net out the P&I or rent already paid, because in both scenarios you needed somewhere to operate the store regardless — that cost is the price of doing business either way, not a differentiator between the two paths.
Worked Case: 4,000 Sq Ft, $1.2M Building, SBA 504 at 10% Down
Assumptions: SBA 504, $120,000 down (10%), $1,080,000 financed at a 6.3% blended rate, 25-year amortization. Lease alternative: $30/sq ft all-in NNN starting rent ($120,000/year), 2.5% annual escalator, 3-month deposit ($30,000). Building appreciates 4%/year (below the compression trend documented in top-tier grocery-anchored cap rates, kept conservative on purpose). Capital difference ($120,000 − $30,000 = $90,000) invested at 6%/year.
| Year | Building Value | Remaining Loan Balance | Equity (Buy) | Cumulative Lease Cost | Opportunity Value (Lease) |
|---|---|---|---|---|---|
| 1 | $1,248,000 | $1,061,000 | $186,500 | $120,000 | $95,400 |
| 2 | $1,297,900 | $1,041,700 | $256,200 | $246,000 | $101,150 |
| 3 | $1,349,800 | $1,020,700 | $329,100 | $377,400 | $107,200 |
| 5 | $1,460,000 | $974,500 | $485,500 | $655,200 | $120,400 |
| 7 | $1,579,100 | $922,200 | $656,900 | $958,700 | $135,300 |
| 10 | $1,776,300 | $830,500 | $945,800 | $1,344,400 | $161,200 |
Monthly P&I is ~$7,190; total P&I paid across 10 years is ~$862,800. Total lease cost across 10 years, with the 2.5% escalator compounding, is ~$1,344,400 — matching the formula Σ R₁(1+e)^(n−1) for n = 1 to 10.
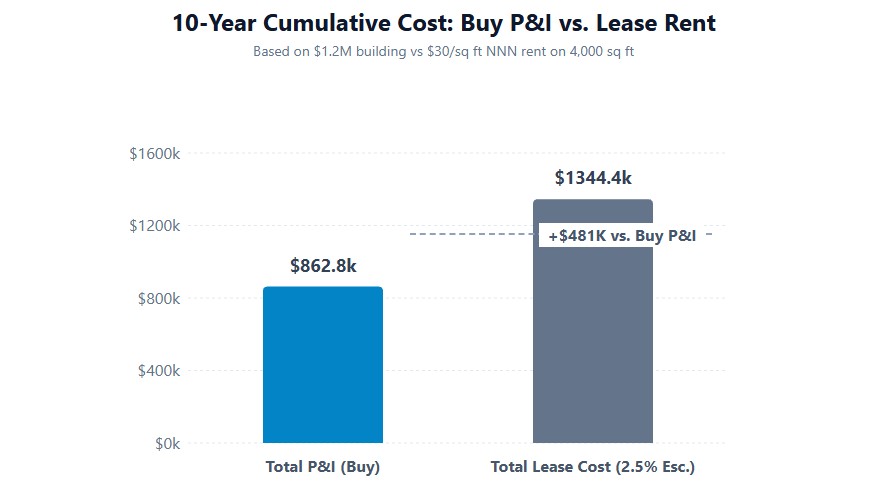
The honest finding: under these assumptions, financed buying leads on equity from year one, and the gap only widens. That’s not a “crossover point” so much as a direct consequence of leverage — a 10% down payment gives you 100% of the appreciation on a $1.2M asset, which a $90,000 alternative investment simply can’t outrun at a 6% return. The transaction-cost breakeven (recovering a typical 6–8% round-trip cost of buying and reselling, roughly $72,000–$96,000 on this building) lands between year 1 and year 2 — Equity(1) minus the $120,000 down payment gives $66,500 in “gain above your own contribution,” which crosses the transaction-cost threshold by year 2 (Equity(2) minus down payment ≈ $136,200).
Where This Flips: The All-Cash Sensitivity Check
Leverage is doing all the work in the table above, so it’s worth showing where the math reverses. If you buy the same building with no financing — full $1,200,000 cash — your equity at year 10 is simply the building’s appreciated value, $1,776,300, since there’s no loan to net out. But the capital difference versus leasing is now $1,200,000 − $30,000 = $1,170,000, invested at 6%/year: $2,095,300 by year 10 — comfortably ahead of the unleveraged building value.
| Scenario | Down Payment | Equity/Value at Year 10 | Opportunity Value at Year 10 | Winner |
|---|---|---|---|---|
| SBA 504 (10% down) | $120,000 | $945,800 | $161,200 | Buy, by a wide margin |
| Conventional (25% down) | $300,000 | $1,068,500 | $483,500 | Buy, by a clear margin |
| All-cash (100%) | $1,200,000 | $1,776,300 | $2,095,300 | Lease + invest the difference |
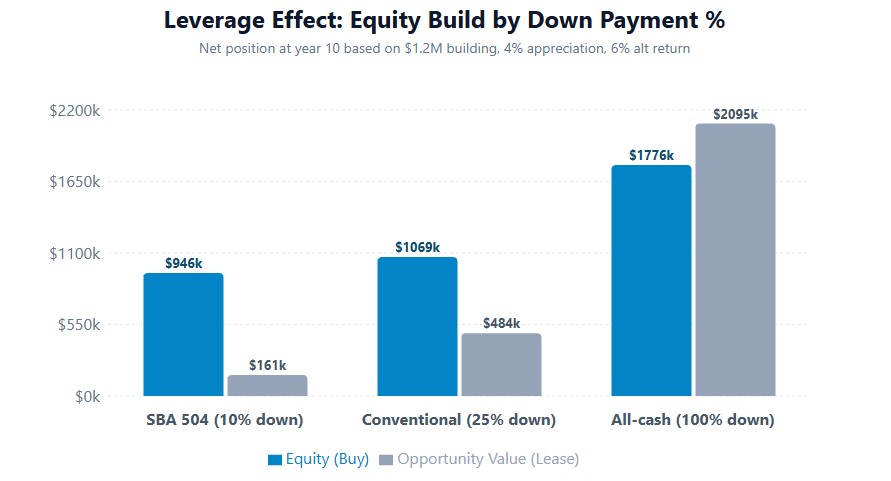
The takeaway: the case for buying a grocery building gets stronger, not weaker, the more leverage you use — which is the opposite of the conventional “debt is risk” intuition, and it’s specifically why SBA 504’s 10% down structure exists for owner-occupied small business real estate. An all-cash purchase is a much closer call, and can lose to leasing plus disciplined investing if your alternative return exceeds the property’s appreciation rate. Very few grocery operators are all-cash buyers, which is exactly why this dynamic doesn’t show up in most generic “buy vs. rent” content aimed at homeowners or small-office tenants.
Where the model breaks in leasing’s favor regardless of financing structure: if you close, relocate, or exit inside 2–3 years, the illiquidity of a special-use retail building (grocery buildouts don’t convert cheaply to other retail uses) can turn “equity” into a slow, discounted sale. Leasing’s flexibility has real value precisely in the early years when the location is least proven.
Grocery-Specific Considerations Generic CRE Advice Misses
1. Your Buildout Is a Sunk Cost Either Way — The Question Is Who Owns It After
Two different cost bases are relevant here, and it’s worth being precise about which one applies. Ground-up new construction of a grocery store runs a 2026 national average of about $215/sq ft, ranging from $140–$175/sq ft for a discount format to $200–$250/sq ft for a full-service conventional supermarket and $280+/sq ft for a specialty format with extensive prepared foods. Interior buildout of an existing shell runs $90–$280/sq ft depending on complexity — consistent with the broader retail fit-out market. Cushman & Wakefield’s 2026 survey put the national average at $157/sq ft, ranging from $120/sq ft in the Midwest to $217/sq ft in Northern California, before grocery-specific premiums for refrigeration plumbing and three-phase electrical push the top end higher. [Cushman & Wakefield, Aug 2026]
If you lease, every dollar of that buildout becomes a landlord fixture the day your lease ends, unless you negotiated removal rights or a buildout reimbursement clause up front. If you own the building, that same buildout is a capital improvement to your own asset — depreciable, and it stays yours if you sell.
2. Refrigeration Financing Terms Now Match Real Estate Terms
The SBA 504 program allows up to 25-year terms on equipment financed as part of a real estate project, not the typical 5–7 year equipment loan term. Financing a $40,000 walk-in cooler over 25 years instead of 7 meaningfully lowers the monthly payment during your thinnest-margin early years — but it only applies cleanly when the equipment is bundled into a real estate purchase, another point in buying’s favor for a category with unusually capital-intensive fixtures relative to most retail tenants.
3. Zoning and Prior-Use History Change the Buy Calculus
A former restaurant space usually already has a grease trap and adequate electrical service; a raw shell doesn’t. When buying, this due-diligence item becomes permanent — you inherit (or fix) the infrastructure forever. When leasing, a bad electrical or plumbing surprise is at least theoretically the landlord’s problem under an NNN lease’s structural carve-outs, though enforcing that against a slow landlord is its own headache. Before committing to a site, confirm the applicable grocery store licensing and permit requirements for the state and municipality.
Sale-Leaseback: Unlocking Capital From a Building You Already Own
This is the strategy most grocery cost content skips entirely, and it’s become more relevant as institutional capital has gotten more aggressive about grocery-anchored real estate.
With $11–$12.8 billion in annual grocery-anchored transaction volume and 85% of institutional retail investors naming the format their top preference, an operator who already owns their building has an option that didn’t exist at this scale five years ago: sell the real estate to an institutional or REIT buyer at a compressed cap rate, sign a long-term NNN lease back on the same building, and convert illiquid real estate equity into deployable cash without moving your store. [Schuckman Realty, June 2026]
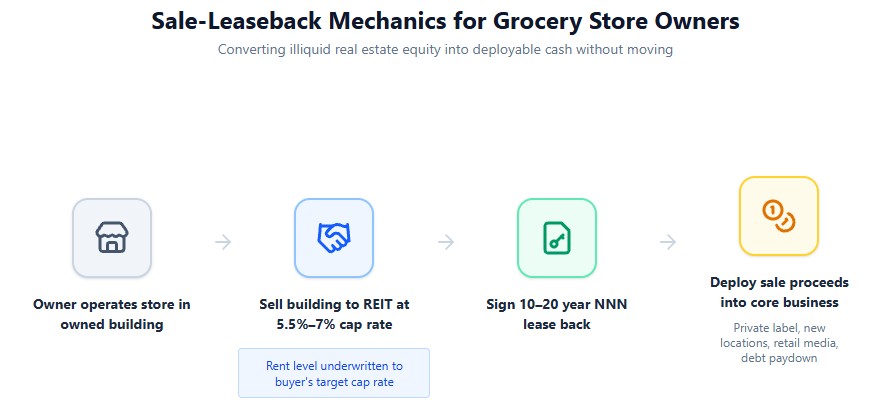
| Element | What Happens |
|---|---|
| You sell the building | To a net-lease REIT, private buyer, or 1031-exchange buyer, typically at a 5.5%–7% cap rate for a stabilized grocery-anchored asset |
| You sign back a 10–20 year NNN lease | On the same building, at a rent level the buyer underwrites to their target cap rate |
| You walk away with | The sale price in cash, minus transaction costs, deployable into private label programs, additional locations, retail media infrastructure, or debt paydown |
| The trade-off | You’ve converted an appreciating asset back into a fixed-rent liability — the leverage advantages in the model above now reverse |
This is precisely the mechanism the largest operators use opportunistically: it’s a capital-allocation decision, not a real estate decision. If your grocery business can compound capital faster inside the store than the real estate is compounding on its own, a sale-leaseback lets you have it both ways over different time horizons. If you don’t have a clear, higher-return use for the capital, you’re simply re-buying the volatility you spent years eliminating.
How the Biggest Grocers Actually Split This Decision
None of the four approaches below is “the model” — each reflects a different balance sheet and growth strategy.
| Operator | Real Estate Approach | Source |
|---|---|---|
| Publix | Owned 31.8% of its stores outright as of the end of 2017 (up from 11.2% a decade earlier), largely unlevered, and has continued acquiring the shopping centers it anchors since — no more recent public ownership-percentage breakdown was available at the time of writing; treat “roughly 30%+ and rising” as the most current verifiable figure | [The Real Deal, 2018; Grocery Dive, 2018] |
| Kroger | Public filings should be used for current lease/ownership figures; the company’s recent real-estate strategy should not be inferred from a commercial brokerage blog alone. Use the current Kroger annual report and 10-K for property commitments, lease obligations, and owned-property disclosures. | [Kroger investor relations] |
| Aldi | Owns and builds a meaningful share of its real estate as part of its U.S. expansion push, but the exact owned-versus-leased percentage is not consistently disclosed in a primary public filing. | Use company announcements and verified commercial-property records for any location-specific claim. |
| Whole Foods (Amazon) | Historically owned a small minority of locations, according to older reporting; current ownership percentages should not be stated as a current fact without an updated primary disclosure. | [Amazon Form 10-K, SEC] |
The pattern that holds up: owning correlates with format stability, low leverage, and long time horizons (Publix); leasing correlates with speed, M&A activity, and format experimentation (Kroger, Whole Foods). If you don’t yet know exactly what your store format looks like in year 5, leasing keeps that option open. If you do, and you can finance it with real leverage, the math above shows ownership locking in an advantage most operators underestimate.
Regional Differences: Buy vs. Lease by City and State
Real estate is the single most location-sensitive line item in a grocery budget, more than labor, more than utilities. The national ranges above compress or expand hard depending on where you’re building.
Rent and Cap Rate Ranges by Metro (2026)
| Metro | Annual Base Rent (NNN, per sq ft) | Grocery/Necessity-Retail Cap Rate | Note |
|---|---|---|---|
| New York City | $55–$85 | ~4.25%–5.25% (gateway, Class A) | Directional planning range; obtain local closed-sale and lease comparables before underwriting. |
| Los Angeles | $38–$55 | ~4.5%–5.25% | Directional planning range; obtain local closed-sale and lease comparables before underwriting. |
| Miami | $47–$75 | ~4.75%–5.0% | Directional planning range; verify against current brokerage and transaction data. |
| Chicago | $22–$24 | ~5.25%–6.5% | Directional planning range; verify against current CBRE/JLL market data and local transactions. |
| Houston | $18–$24 | ~5.5%–7.0% | Directional planning range; verify against current brokerage and transaction data. |
Rent and cap-rate figures in this table are directional planning ranges, not records of closed transactions or appraisals. Use current CBRE, JLL, Cushman & Wakefield, CoStar, or local broker transaction data for an acquisition decision.
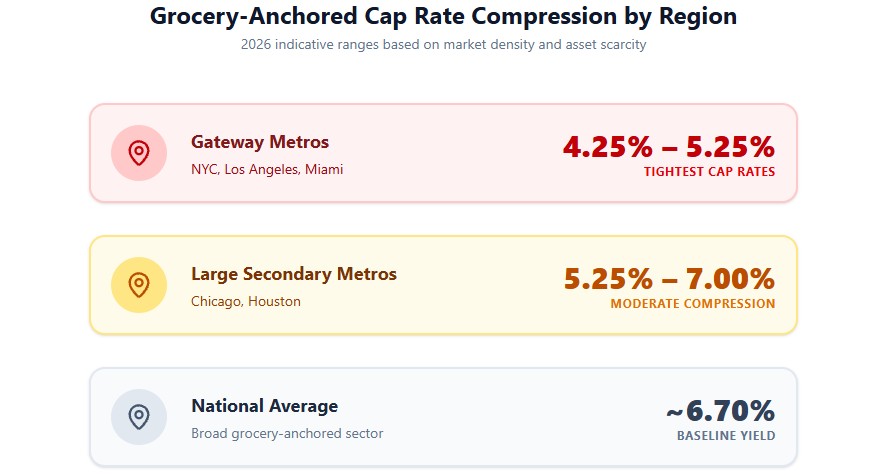
What this means practically: in NYC and LA, a lower cap rate means you pay more per dollar of rental income to buy the same building — ownership requires more capital to reach the same leverage ratio, but the asset is also the one institutional buyers are competing hardest for, which supports resale value. In Houston and Chicago, cap rates run wider and entry prices lower, so a given down payment buys proportionally more building — but you’re also in a market where new retail supply is easier to add, which caps how much the “scarcity premium” argument applies to your own resale a decade out.
State-Specific Factors That Change the Math
| Factor | Detail | Effect on Buy vs. Lease |
|---|---|---|
| Florida’s commercial rent sales tax — repealed | Florida’s Department of Revenue should be treated as the controlling source for the effective date and scope of the repeal. | This removes a tax-driven incentive to own rather than lease in Florida that existed before the repeal — verify the treatment of any local surtax, transition period, or lease-specific exception before finalizing an underwriting model. |
| Liquor license quota states | California, Pennsylvania, Ohio, and others cap the number of beer/wine licenses by county; where the quota is full, a license may trade on the secondary market. The amount varies materially by jurisdiction and license class. | An owned building with an existing, transferable license attached can carry meaningful additional value in quota states — factor this into a purchase price comparison, not just square footage. |
| Property tax rate variance | Property tax is a landlord pass-through in a leased NNN deal regardless of state, but it’s a direct carrying cost with no offsetting rent income if you own; rates vary materially by state and locality. | Owning in a high-property-tax state raises the effective cost of ownership beyond what the mortgage payment alone suggests. |
| Commercial mortgage/SBA loan terms | Federal programs (SBA 504, 7(a)) don’t vary by state, but local bank appetite, appraisal conservatism, and construction-cost inflation do. | Two identical stores in different states can see meaningfully different blended financing rates purely from local lender competition. |
Risk Matrix
| Risk | Buy | Lease |
|---|---|---|
| Illiquidity | High — special-use grocery buildings attract a narrower buyer pool than generic retail space, lengthening sale timelines if you need to exit | Low — walk at lease expiration (subject to termination penalties if early) |
| Capex responsibility | 100% yours: roof, HVAC, parking lot, structural repairs | Landlord typically covers structural/major systems in NNN; you cover interior and equipment, subject to the lease |
| Rent/cost escalation | None after the loan is fixed (SBA 504 and most conventional mortgages are fixed-rate) | 2–3%/year contractual escalators compound significantly over a 10–20 year term |
| Renewal risk | None — you can’t be “not renewed” by yourself | Real — landlord can decline renewal, raise rent sharply at option exercise, or redevelop the site at lease end |
| Co-tenancy/neighbor risk | Limited, unless you own only your building within someone else’s center | Real, unless a co-tenancy clause is negotiated — an anchor tenant failure next door can crater foot traffic |
| Interest rate exposure | Locked at purchase if the loan is fixed-rate | Indirect — landlord’s own financing costs and market rent growth flow into your renewal rate |
| Format flexibility | Low — expensive to resize, relocate, or reformat | Higher, within lease-term constraints |
Decision Checklist: Buy or Lease?
Lean Toward Buying If:
| Criterion | Threshold | Why It Matters |
|---|---|---|
| Planned time horizon in this location | 8–10+ years | The financial model shows leveraged buying’s equity advantage compounding from year one; shorter horizons don’t let it build enough cushion against transaction costs and market risk |
| Available capital for a 10% SBA 504 down payment | $100,000–$200,000+ liquid, without depleting your inventory/opening-capital budget | Underfunding the down payment while starving opening inventory is a common and avoidable failure mode |
| Local cap-rate/transaction-volume trend | Stable-to-compressing (check regional comps against the table above) | Buying into a declining secondary market erases the equity-building advantage |
| Format certainty | You know your final square footage, department mix, and service-counter plan | Owning locks in a format; expensive to unwind if you guess wrong |
| Financing structure | You can access real leverage (SBA 504/conventional), not an all-cash purchase | The sensitivity analysis above shows an all-cash purchase is a much closer call against leasing plus investing |
Lean Toward Leasing If:
| Criterion | Threshold | Why It Matters |
|---|---|---|
| This is your first location | Yes | Prove the concept before committing 10–25 years of capital to one address |
| Capital is tight relative to opening-day needs | Down payment would eat into inventory, distributor deposits, or working capital reserve | A well-stocked leased store beats a half-stocked owned one |
| You’re planning to scale to multiple locations in 3–5 years | Yes | Leasing preserves capital and balance-sheet flexibility for expansion |
| The site’s long-term trajectory is uncertain | New development, unproven trade area, pending competitor entry | Leasing lets you exit or renegotiate if the trade area underperforms |
Consider a Hybrid or Sale-Leaseback If:
| Situation | Move |
|---|---|
| You already own your building and need capital for private label, a second store, or retail media infrastructure | Evaluate a sale-leaseback against your expected in-store return on that capital versus the real estate’s own appreciation trajectory |
| You want ownership’s fixed-cost benefit but can’t clear a 10–20% down payment today | Negotiate a lease with a purchase option or right of first refusal, common in build-to-suit anchor deals |
| Your market has both compressing cap rates and rising rents | Check SBA 504+7(a) combined financing (up to $10M as of July 2026) before assuming you can’t afford ownership |
2026–2028 Outlook
| Factor | Effect on Buy vs. Lease Decision | Timeline |
|---|---|---|
| Grocery-anchored cap rate compression (national average ~6.7%, down ~40 bps from 2023 peak; top-tier centers 5.25–5.8%) | Favors buying where you can find product — but acquisition prices keep rising, narrowing the window | 2026–2027 |
| New retail construction well below 10-year average | Scarcity supports value for owners; makes finding a lease-ready, food-service-equipped space harder for new entrants | 2026–2028, structural |
| SBA 504 + 7(a) combined financing up to $10M (effective July 2026) | Removes the historical financing gap between real estate and equipment/working capital needs for growing operators | Immediate |
| Institutional and REIT competition for grocery-anchored assets ($11–$12.8B in transaction volume through Q1 2026) | Independent buyers increasingly compete with institutional capital for well-located sites — expect longer search timelines on institutional-grade product | 2026–2028 |
| Florida commercial rent tax fully repealed (Oct 2025) | Narrows one of the clearest state-specific tax incentives to own rather than lease | Already in effect |
| Rate environment (commercial mortgages ~6.0–8.75%, SBA 504 blended ~6.0–6.5%) | A moderating-rate environment versus the 2023–2024 peak narrows the gap between buy and lease monthly costs, making ownership’s math more favorable than it was two years ago | 2026, with further Fed movement to watch |