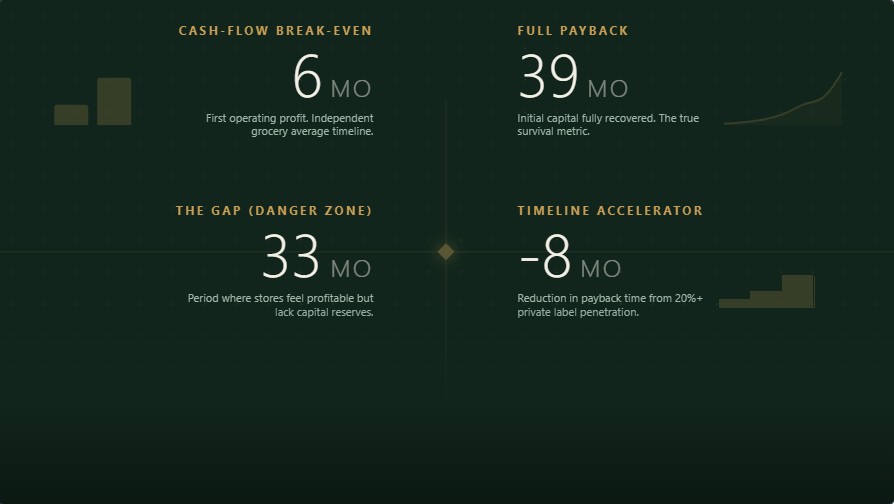
A corner store can post its first profitable month by month 3–5. A full-service supermarket usually doesn’t get there before month 12–15. But “profitable month” and “break-even” are not the same milestone — and confusing them is the single most common budgeting mistake new grocery operators make. The real number that decides whether your business survives is full payback: the point where cumulative profit finally repays every dollar of startup capital. For most independent grocery stores, that’s 18 to 39 months, not the 6-to-12-month figure most generic guides throw around. [U.S. Census Bureau, 2026] Understanding this timeline is critical for accurate grocery store break-even analysis.
“A store may post its first profitable month in months five through nine and still need twelve to twenty-four months to stabilize working capital, supplier terms, staffing, and seasonal buying.” — Independent grocery financial modeling analysis, 2026
This breakdown separates the three break-even points that actually matter, models the timeline by store format and city, and shows what accelerates or wrecks the curve.
The Three Break-Even Points (Most Guides Only Track One)
Generic advice treats “break-even” as a single number. Operationally, there are three distinct milestones, and each one answers a different question.
| Break-Even Type | What It Measures | Typical Timing | Why It Matters |
|---|---|---|---|
| Unit/Sales Break-Even | Monthly revenue needed to cover that month’s fixed + variable costs | Ongoing — recalculated every month | Tells you if this specific month made or lost money. Doesn’t account for startup debt. |
| Cash-Flow (Operating) Break-Even | The first calendar month where revenue exceeds total costs | Month 3–15 depending on format | The milestone most owners celebrate — but the business can hit this and still be deep underwater on total capital. |
| Full Payback Break-Even | The point where cumulative net profit equals total startup investment | Month 18–39 (independent), up to 59 in slipped scenarios | The number that actually determines survival. Lenders and investors care about this one, not the first profitable month. |
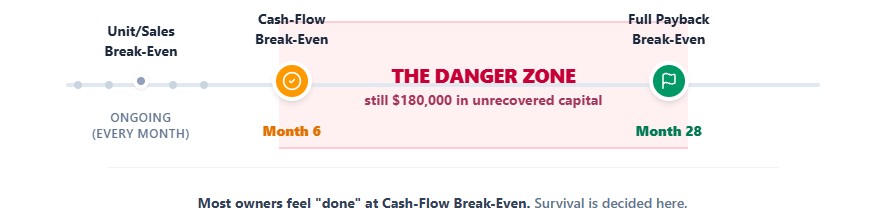
The gap between these two milestones is where most grocery failures happen. A store can hit cash-flow break-even in month 6, feel like it “made it,” relax on cost discipline, and still run out of working capital in month 14 because $180,000 of startup debt hasn’t been touched yet.
Break-Even Timeline by Store Format
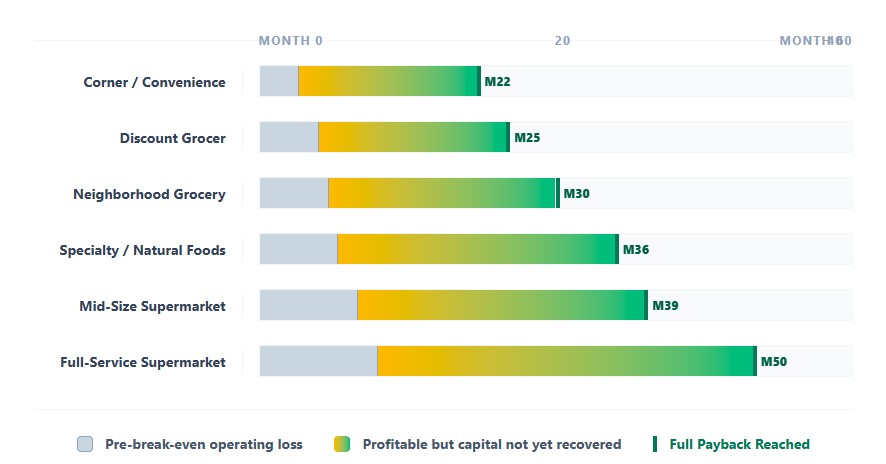
Format drives the number more than any other variable — startup capital, fixed cost load, and revenue ramp speed all move together.
| Format | Startup Investment | Monthly Fixed Costs (Steady State) | Monthly Break-Even Sales Needed | Cash-Flow Break-Even | Full Payback Break-Even |
|---|---|---|---|---|---|
| Corner / Convenience | $80,000–$180,000 | $18,000–$32,000 | $55,000–$95,000 | Month 3–5 | Month 18–26 |
| Discount Grocer (ALDI-style) | $400,000–$800,000 | $55,000–$90,000 | $180,000–$260,000 | Month 4–8 | Month 20–30 |
| Neighborhood Grocery (Independent) | $300,000–$700,000 | $65,000–$110,000 | $200,000–$310,000 | Month 5–9 | Month 24–36 |
| Specialty / Natural Foods | $500,000–$1.2 million | $95,000–$170,000 | $260,000–$420,000 | Month 6–11 | Month 30–42 |
| Mid-Size Independent Supermarket | $700,000–$1.5 million | $165,000–$330,000 | $450,000–$780,000 | Month 7–13 | Month 30–48 |
| Full-Service Supermarket | $1.5 million–$5 million+ | $420,000–$950,000 | $1.1M–$2.3M | Month 9–15 | Month 42–59 |
Data Notes: Monthly fixed costs reflect steady-state payroll, rent, utilities, and insurance (see prior cost breakdown for detail by category). Break-even sales assume a blended contribution margin of 25%–33% depending on format. Full payback assumes no major disruption (recall, key supplier loss, regional demand shock); add 6–12 months if one occurs. [BLS, 2026]
Why the Range Is So Wide Within Each Format
Two neighborhood grocers with identical square footage can land 12 months apart on full payback. The variables that explain the spread:
- Contribution margin discipline — a store running 33% blended margin (heavy private label, disciplined shrink control) pays back 20%–30% faster than one running 25% on mostly national brands. Learn more about our private label grocery strategy.
- Opening inventory depth — an under-stocked opening reads as “struggling” to first-time customers and permanently caps foot traffic in a market where word-of-mouth compounds; this shows up as a flatter ramp curve, not a one-time hit.
- Working capital cushion — stores that raised 9–12 months of reserve don’t make panic decisions (discounting to force cash flow, cutting marketing) during the months-4-through-9 trough that a 6-month-reserve store is forced into.
Break-Even Contribution Margin by Department
The 25%–33% blended contribution margin used above is a starting point, not a modeling tool. Two stores with identical blended margins can have completely different break-even sensitivity depending on department mix — a store leaning on deli and prepared foods carries a much higher labor drag on that margin than one leaning on center-store dry goods.
| Department | Gross Margin | Labor as % of Sales | Net Contribution to Break-Even | Break-Even Role |
|---|---|---|---|---|
| Produce | 35%–45% | 8%–12% | ~25%–35% | Strong contributor once shrink (5%–10%) is controlled; volatile on tariff-exposed imports. See our guide on shrinkage in grocery stores. |
| Dairy/Refrigerated | 25%–35% | 5%–8% | ~20%–28% | Steady, low-volatility contributor; traffic driver more than margin driver |
| Meat/Seafood | 30%–40% | 15%–20% | ~13%–22% | High gross margin, but labor-intensive service model cuts its net break-even contribution roughly in half |
| Frozen Foods | 25%–35% | 3%–5% | ~22%–31% | Best labor-to-margin ratio in the store; underweighted in most independent assortments |
| Center-Store / Dry Goods | 15%–25% | 2%–4% | ~13%–22% | Lowest margin but lowest labor and shrink; stabilizes the break-even model rather than driving it |
| Deli/Prepared Foods | 55%–65% | 40%–50% | ~10%–20% | Highest sticker margin in the store but the weakest net break-even contributor once labor is netted out |
| Private Label (all categories) | +25–35% vs. national brand | Same as category | Add 4–8 pts to whichever department it sits in | The single fastest lever for lifting blended break-even contribution without a price increase |
How to use this table: don’t model your blended contribution margin off store-wide averages. Pull your own department sales mix and weight each department’s net contribution accordingly — a store running 30% of sales through deli/prepared foods should model closer to 22%–26% blended contribution, not the 25%–33% range that assumes a more center-store-heavy mix. For deeper insights, review our analysis of grocery store unit economics & profit centers and grocery store profit margins.
Do the Math: The Break-Even Formula
Most operators calculate this backwards — they build the store, then find out what sales number they need. Do it in the other order.
| Step | Formula | Worked Example: 3,500 sq ft Neighborhood Grocery |
|---|---|---|
| 1. Total monthly fixed costs | Rent + payroll (base) + insurance + utilities + loan service | $18,000 rent + $58,000 payroll + $2,200 insurance + $3,500 utilities + $6,300 loan payment = $88,000 |
| 2. Blended contribution margin | (Gross margin − variable-with-sales costs like credit card fees, bagging supplies) | 27% gross margin − 2% variable overhead = 25% contribution margin |
| 3. Monthly break-even sales | Fixed costs ÷ contribution margin | $88,000 ÷ 0.25 = $352,000/month |
| 4. Break-even daily transactions | (Break-even sales ÷ average basket) ÷ days open | ($352,000 ÷ $42.83 independent avg. basket) ÷ 30 = ~274 transactions/day [FMI, 2025] |
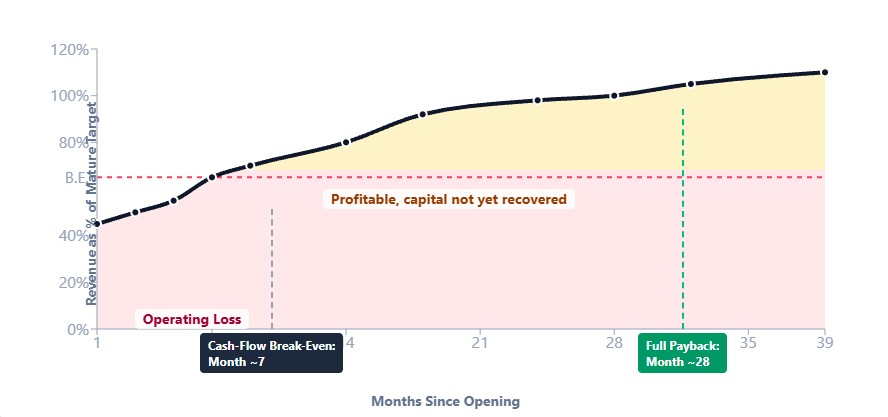
| 5. Cash-flow break-even month | First month projected sales ≥ break-even sales on the ramp curve | Month 7 on a typical 39-month ramp |
| 6. Full payback month | Cumulative net profit after month 7 recovers remaining startup capital | Month 28 |
The step people skip: step 4. Translating a dollar target into a daily transaction count is what makes the number real to store-level staff — “we need 274 transactions a day” is actionable in a way “$352,000 a month” isn’t.
Break-Even Calculator
Your Numbers
+ Model a single category (optional)
▾Your Break-Even
The Ramp Curve: Month-by-Month Path to Profitability
Break-even isn’t a cliff you fall off of on day one and climb back over on a fixed date — it’s a curve, and the shape of that curve matters more than any single month’s number.
| Phase | Months | Revenue vs. Mature Target | Status | What’s Happening |
|---|---|---|---|---|
| Launch Trough | 1–4 | 40%–60% of mature sales | Operating loss | Customer habits not yet formed, opening inventory still working through the store, staff still learning departments |
| First Traction | 5–9 | 60%–85% of mature sales | Crosses cash-flow break-even | Repeat customers establish weekly patterns; loss leaders and basket-building begin compounding; first profitable month typically lands here |
| Stabilization | 10–18 | 85%–100% of mature sales | Profitable but capital-constrained | Revenue near mature levels, but supplier terms, staffing levels, and seasonal buying patterns are still being tuned; cumulative cash may still be negative |
| Sustained Profitability | 18–39 | 100%+ of mature sales | Full payback achieved | Startup capital fully recovered; store operating at or above modeled net margin (1.5%–2.5% conventional, 3%–6% discount/specialty) |
Context: A 4,000 sq ft neighborhood grocery targeting the FMI supermarket benchmark of roughly $19.59 per square foot per week should underwrite conservatively — 60%–80% of that figure — until its own traffic study and household-spend data justify more. That puts a realistic mature target in the $2.0M–$3.3M annual range for that footprint, with break-even typically crossing in month five to nine of the ramp. [FMI, 2025]
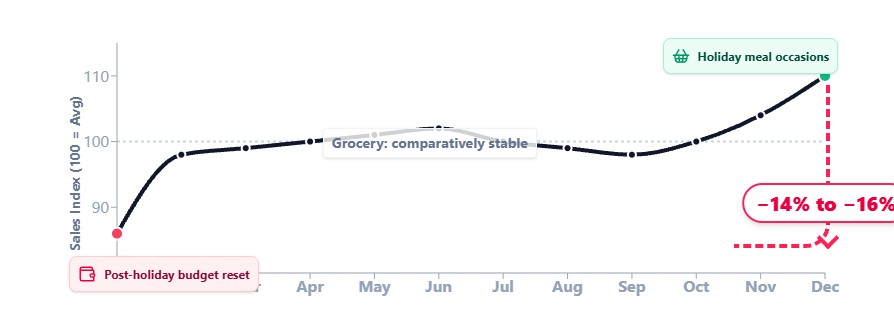
Seasonality: Adjusting the Ramp for Holiday Spikes and January Troughs
The ramp curve above assumes a flat trajectory month to month, which understates real volatility. Grocery is one of the more seasonality-resistant retail categories — food-at-home spending swings far less across the year than general retail — but it is not seasonality-free, and the swing that does exist is concentrated at a specific calendar point that matters directly for break-even timing.
What the Data Actually Shows
| Period | Effect | Source |
|---|---|---|
| November–December | Food-at-home sales rise measurably, driven by holiday meal occasions; the increase is real but far smaller than the 20%+ swings seen in general merchandise or e-commerce categories | [USDA ERS, 2025] |
| December → January | Food-at-home sales decline 14%–16% month-over-month, the sharpest single-month swing in the grocery calendar, driven by post-holiday budget resets rather than reduced food consumption | [USDA ERS, 2025–2026] |
| Summer (June–August) | Grocery is comparatively stable versus the sharp holiday-to-January swing; expect softer week-over-week volatility rather than a defined slump, though individual categories (baking, soup, hot beverages) do dip | Directional — not independently benchmarked at the national grocery level |
What This Means for Your Break-Even Model
- Don’t open in October–November expecting your first months to represent a “normal” run rate. A store opening into the holiday season will show an artificially strong early ramp that softens in January — model your cash-flow break-even test against February–March performance, not the opening quarter.
- Build the January dip into your working capital reserve calculation, not just your revenue forecast. A store that hits cash-flow break-even in a strong December can still post a genuine operating loss in January and February; that’s a seasonal pattern, not a sign the business is off track — but only if you sized the reserve to absorb it.
- Weight department mix for the holiday window. Deli, bakery, and produce (holiday meal categories) see the clearest seasonal lift; center-store dry goods see the least. A store overweighted in center-store won’t capture as much of the December bump as the department table above would suggest.
Break-Even by City: Same Store, Different Timeline
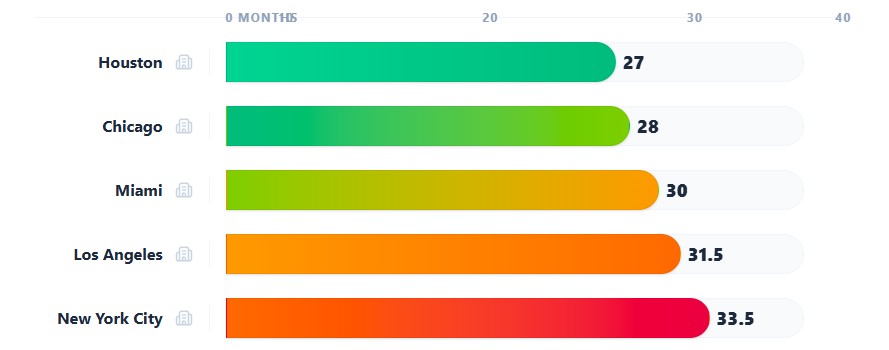
The cost-to-open breakdown for a 2,500 sq ft neighborhood grocery already showed startup capital swinging from $471,000 (Chicago) to $564,000+ (NYC). That same spread pushes full payback months apart, because higher rent and wages raise the break-even sales bar every single month, not just at open. See our guide on how much it costs to open a grocery store.
| City | Startup Capital | Monthly Fixed Costs | Break-Even Sales Needed | Est. Full Payback |
|---|---|---|---|---|
| Houston | $473,000–$732,000 | $52,000–$70,000 | $190,000–$260,000/mo | Month 22–32 |
| Chicago | $471,000–$738,000 | $55,000–$75,000 | $200,000–$275,000/mo | Month 23–33 |
| Miami | $532,000–$803,000 | $62,000–$85,000 | $225,000–$305,000/mo | Month 25–35 |
| Los Angeles | $543,000–$825,000 | $68,000–$92,000 | $245,000–$330,000/mo | Month 26–37 |
| New York City | $564,000–$851,000 | $75,000–$100,000 | $265,000–$355,000/mo | Month 28–39 |
Takeaway: the same store format, built to the same spec, pays back roughly 6–8 months faster in Houston or Chicago than in NYC — almost entirely a function of rent and wage load on the monthly break-even number, not a difference in how good the operator is. [U.S. EIA, 2025]
What Speeds Up (or Wrecks) the Break-Even Curve
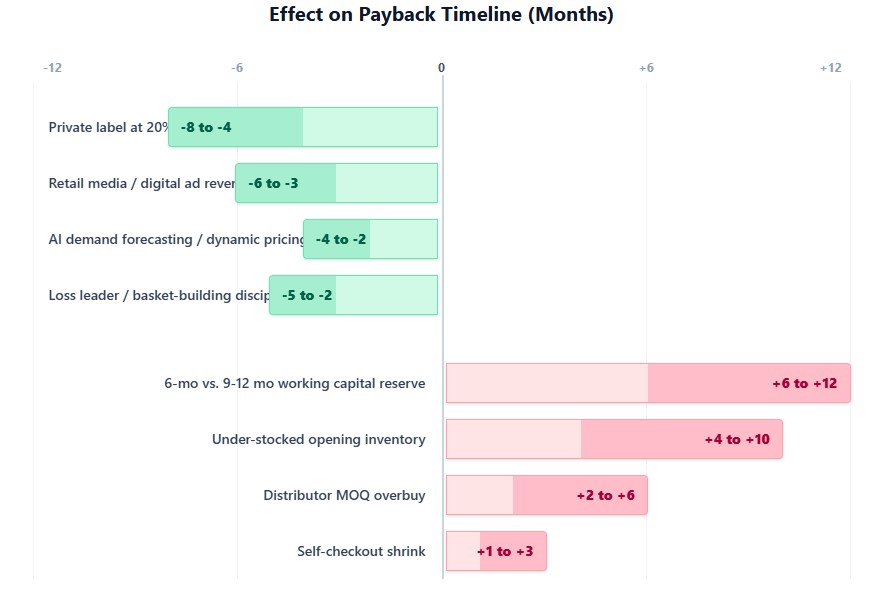
Break-even timing isn’t fixed once you sign the lease. Several operating levers move the payback date by months in either direction.
| Factor | Effect on Payback | Mechanism |
|---|---|---|
| Private label at 20%+ penetration | −4 to −8 months | Lifts blended gross margin 1.5–2 points, directly raising contribution margin without raising prices to customers |
| Loss leader / basket-building discipline | −2 to −5 months | Rotisserie chicken, milk, and eggs priced at or below cost pull customers past higher-margin categories; done well, adds 3%–8% to overall store profitability |
| Retail media / digital ad revenue | −3 to −6 months (mid-size and up) | 50%–75% margin revenue stream that doesn’t depend on food sales volume at all |
| Under-stocked opening inventory | +4 to +10 months | First-time customers read a thin shelf as “struggling,” permanently softening the traction-phase ramp |
| Self-checkout shrink | +1 to +3 months | 3.5%–4% shrink at self-checkout lanes (vs. under 1% at cashier lanes) quietly erodes the margin the break-even math assumes |
| Distributor MOQ overbuy | +2 to +6 months (one-time) | Forced 2–3x inventory purchases to meet minimum order quantities tie up capital that should be funding the working capital reserve |
| 6-month vs. 9–12 month working capital reserve | +6 to +12 months | Under-reserved stores are forced into panic discounting or marketing cuts during the months-4-through-9 trough, flattening the ramp |
| AI demand forecasting / dynamic pricing | −2 to −4 months (mid-size and up) | 3%–8% margin improvement on optimized categories plus 15%–25% shrink reduction, both compounding into the contribution margin |
Sourcing note: the underlying mechanics in this table are documented and sourced — private label margin lift, retail media economics, self-checkout shrink rates, and distributor MOQ terms are covered with citations in the accompanying Grocery Store Profit Margins and Private Label Strategy breakdowns. The specific month-delta estimates above (e.g., “−4 to −8 months”) are Bissnest’s own financial modeling based on those mechanics, not figures published in a named third-party study — treat them as directional, not exact.
Net effect: a mid-size independent doing everything right (strong private label, disciplined loss leaders, adequate reserve, no supply shock) can pull full payback in from month 42 to month 28–30. One doing everything wrong (thin inventory, undercapitalized reserve, no private label) can push the same store past month 50.
Case Studies: What Actually Happened to the Timeline
The three scenarios below are illustrative composites, not single documented case studies — each is modeled on cost and timeline patterns commonly reported across independent-grocer trade coverage and the financial-modeling benchmarks cited throughout this piece, rather than on one specific named store.
| Scenario | What Happened | Lesson |
|---|---|---|
| Regional neighborhood grocer, 4,200 sq ft (illustrative scenario based on industry financial modeling benchmarks) | Opened with a 6-month working capital reserve instead of the recommended 9. Hit cash-flow break-even on schedule in month 7, but a slow produce season in months 9–11 forced a $40,000 emergency draw against a personal line of credit to cover payroll. Full payback pushed from a modeled month 26 to month 34. | The reserve isn’t there for the average month — it’s there for the two or three below-average months that happen inside every ramp curve. Undersizing it by even 3 months of runway shows up as an 8-month payback delay. |
| Discount-format entrant, 9,000 sq ft (illustrative scenario) | Launched with 78% private label penetration from day one (Aldi-style model), reducing SKU count and labor accordingly. Hit cash-flow break-even in month 4 — faster than the format average — because fixed costs were structurally lower and margin per SKU was higher from the start. | Format choice front-loads the break-even outcome. A discount-format store isn’t “trying harder” to break even faster — it built a lower break-even bar into the business model itself. |
| Specialty/organic entrant, 6,500 sq ft (illustrative scenario) | Modeled a 30-month payback based on category-average specialty margins (4%–6.5% net). Actual buildout ran 22% over budget due to commercial kitchen requirements for prepared foods, pushing total startup capital from $780,000 to $950,000 without a corresponding revenue increase. Full payback landed at month 39 instead of 30. | Specialty formats carry higher margin potential but also the highest buildout cost variance of any format (commercial kitchen, specialized refrigeration). A break-even model built before final buildout bids is a placeholder, not a plan. |
Red Flags: How to Tell You’re Off Track
Use these checkpoints against the standard ramp curve above. Being behind at any single checkpoint isn’t fatal — being behind at two consecutive checkpoints usually is.
| Month | On-Track Signal | Red Flag | If You’re Behind |
|---|---|---|---|
| Month 4 | Revenue at 40%–60% of mature target | Revenue under 35% of mature target | Audit opening inventory depth and in-stock rate before anything else — a thin shelf is the most common cause |
| Month 9 | Crossed cash-flow break-even; blended margin within 2 points of model | Still posting monthly operating losses | Check contribution margin first, not just top-line sales — a margin shortfall means a pricing or shrink problem, not a traffic problem |
| Month 18 | Revenue at 85%–100% of mature target; working capital reserve still has 3+ months of runway | Reserve under 2 months of runway remaining | Stop discretionary spending (marketing tests, SKU expansion) and stabilize before pushing growth initiatives |
| Month 30 (neighborhood/mid-size) | Cumulative payback tracking within 20% of modeled timeline | Payback pushed more than 12 months past model with no clear one-time cause | This usually indicates a structural margin problem (wrong format for the location, distributor terms never renegotiated after year one) rather than a timing issue — worth a full cost-structure review |
Bottom Line
Stop measuring “profitable” by the first good month. Track all three break-even points: unit/sales break-even (did this month work), cash-flow break-even (has the business turned the corner), and full payback (has the startup capital actually come back). For most independent grocery stores, cash-flow break-even lands in month 5–13 depending on format, but full payback takes 18–39 months — and city, format, and operating discipline can each move that date by 6–12 months in either direction. Model the ramp curve before you open, not after: know your break-even daily transaction count, not just the monthly dollar figure. Size your working capital reserve for the trough months (4–9), not the average month. And treat private label, loss leader discipline, and shrink control as break-even accelerants, not side initiatives — together they can pull full payback in by 6–14 months on the same store, in the same location, with the same starting capital.