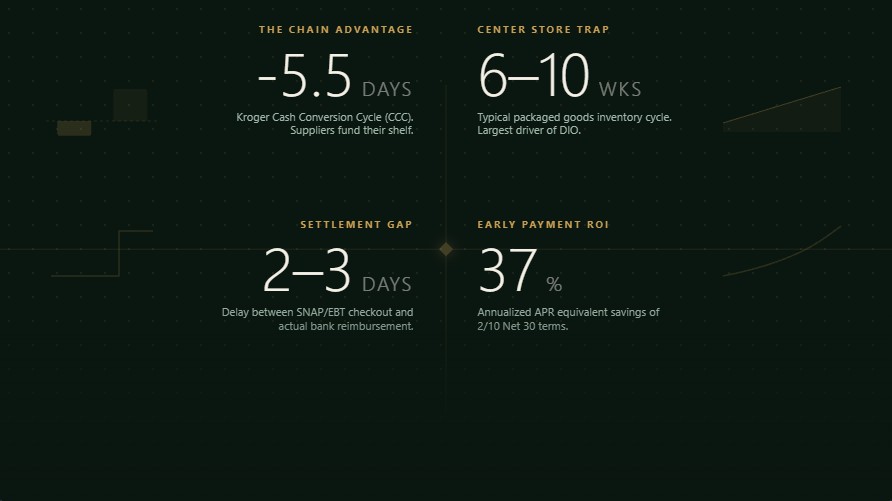
Grocery is famous in finance circles for running on a negative cash conversion cycle — collecting from customers before paying suppliers, which effectively funds growth with other people’s money. That’s true for chains with real supplier leverage. It’s usually not true for an independent store, which typically operates the opposite way: paying suppliers faster than it collects the benefit of that inventory. Understanding which side of that line your store is on — and how to move it — is most of what grocery store cash flow management actually is.
The Cash Conversion Cycle: Chains vs. Independents
The cash conversion cycle (CCC) measures how many days pass between paying for inventory and collecting cash from it:
CCC = DIO + DSO − DPO
- DIO (Days Inventory Outstanding) = (Average Inventory ÷ COGS) × 365 — how long stock sits before it sells. For more details, see our guide on grocery store inventory turnover ratio.
- DSO (Days Sales Outstanding) = (Average Accounts Receivable ÷ Total Credit Sales) × 365 — how long it takes to collect after a sale (near-zero in grocery, since most sales are cash or card, not invoiced)
- DPO (Days Payable Outstanding) = (Average Accounts Payable ÷ COGS) × 365 — how long you take to pay suppliers
A negative CCC means you’re collecting cash before your supplier payment is due — inventory growth funds itself instead of draining cash.
| Company | DIO | DSO | DPO | CCC |
|---|---|---|---|---|
| Kroger | 18.2 days | 4.3 days | 28.0 days | −5.5 days |
| Walmart | — | — | — | +4.5 days |
| Costco | — | — | — | +3.4 days |
Kroger figures are trailing-quarter data as of April 2026 (GuruFocus, Kroger Cash Conversion Cycle); Walmart and Costco figures reflect the same balance-sheet methodology applied by financial analysts comparing the three chains.
Kroger’s negative CCC comes from stretching payables to 28 days against inventory that turns in about 18 — the supplier is effectively financing the shelf. Walmart and Costco run slightly positive despite their scale, because membership and bulk-purchase models behave differently. Either way, all three numbers assume supplier terms in the 30-60 day range and inventory that turns every two to three weeks. That’s the leverage of a chain buying in volume with a decades-long payment history.
Why Independents Don’t Get the Same Terms
Wholesale trade credit is tiered by account size and history, and a new grocery account starts at the bottom of it. Distributors commonly require cash on delivery (COD) or cash in advance for a new account with no payment history, and graduate accounts to Net 30 only after several clean payment cycles — regional chains typically get Net 60, and national accounts get Net 90. That means a new independent store is often paying its supplier before or at delivery, while its inventory still takes one to three weeks to sell through — a positive cash conversion cycle, the opposite of the Kroger example above, at the exact moment the business has the least cash cushion to absorb it.
The path off COD is mechanical, not magical: consistent order volume, on-time payment history, and trade references are what get a distributor to move an account from COD to Net 15, then Net 30. There’s also a shortcut most independents underuse: joining a retailer-owned buying cooperative or wholesale group (the model behind banners like IGA, or regional co-ops such as Associated Grocers and Unified Grocers). Because the cooperative — not your single store — carries the payment history and order volume with the distributor, a new member can often step directly into Net 15 or Net 30 terms that would otherwise take years to earn alone, on top of better unit pricing. It’s worth pricing out membership costs against what those terms alone would be worth to your CCC before ruling it out.
If a distributor offers an early-payment discount — commonly structured as 2/10 Net 30 (2% off if paid within 10 days instead of 30) — that discount is worth taking if you have the cash: annualized, a 2/10 Net 30 discount works out to roughly 37% APR-equivalent savings, far better than what a line of credit costs to carry that same float.
Practical order for improving your CCC as an independent:
- Push DPO first — ask every supplier what it takes to move from COD to Net 15 or Net 30; this moves the fastest and costs nothing to ask.
- Price out a buying cooperative — if you’re not already in one, compare what a co-op’s negotiated terms and volume pricing would do to your DPO and COGS against the membership cost.
- Cut DIO in your slowest-turning department — center store and general merchandise (see below) are usually where cash is parked longest; trim order quantities there before touching produce.
- Keep DSO near zero — grocery’s natural advantage is almost no receivables; avoid extending informal credit to institutional or bulk buyers unless you’re prepared to manage it like a real AR process.
- Take early-payment discounts once cash allows — 2/10 Net 30 lowers your effective DPO slightly but the discount return outweighs the float you give up.
- Re-check terms annually — a supplier relationship with two years of clean payment history should be renegotiated, not left on its original terms by default.
Inventory Turnover by Department
Inventory is the biggest lever an independent grocer actually controls, and it doesn’t turn at one uniform rate — treating it as a single number hides where cash is actually getting stuck.
| Department | Typical Turnover | Cash Implication |
|---|---|---|
| Produce | Weekly or faster | Fast cash recovery, but high shrink risk if overordered. Learn more about shrinkage in grocery stores. |
| Dairy | 1–2 weeks | Fast-turning, tight date-code management needed |
| Frozen | 3–6 weeks | Slower cash recovery, lower shrink risk |
| Center store (packaged goods) | 6–10 weeks | Largest single driver of DIO on a typical P&L |
| General merchandise/seasonal | 10+ weeks | Highest cash-tie-up risk; overbuying here is the most common inventory cash trap |
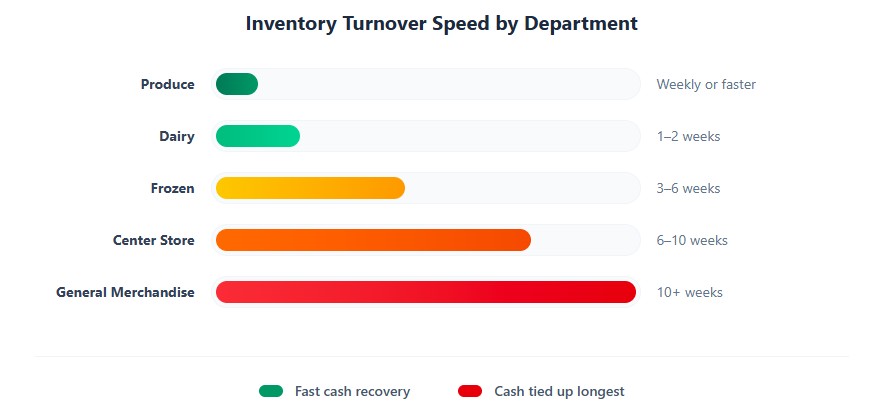
In practice, it’s center store and general merchandise — not produce — where a struggling independent’s cash usually ends up parked, since produce is the department most often blamed first simply because its shrink is the most visible.
SNAP and EBT: A Built-In Cash Flow Cycle
If SNAP is a meaningful share of your sales, your monthly cash flow already has a shape to it, whether you’ve planned for it or not. Three mechanics drive it:
- Demand isn’t evenly distributed across the month. Federal rule (7 CFR 274.2) requires states to stagger SNAP issuance rather than depositing everyone’s benefit on the same day, to avoid overwhelming stores and the EBT network — but staggering still concentrates demand into predictable windows tied to your state’s specific schedule.
- Food sales rise by an average of 5.6% for a typical grocer in the week following SNAP issuance (Goldin, Homonoff & Meckel, “Issuance and Incidence: SNAP Benefit Cycles and Grocery Prices,” NBER working paper).
- 56% of SNAP benefits are spent within seven days of being issued (Colleen Heflin, Syracuse University, cited via Maxwell School news coverage).
If your store sits in a market with a meaningful SNAP customer base, map your own POS data against your state’s issuance calendar — the surge is real and repeatable, not random.
- WIC runs on a separate, stricter clock. If you’re an authorized WIC vendor, don’t fold it into your SNAP planning — WIC reimbursement is processed through a different state-level system than SNAP’s EBT network, often on its own settlement schedule, and it comes with fixed minimum-stocking requirements for approved foods regardless of how fast those specific items turn. Track WIC reimbursement separately in your cash flow forecast rather than lumping it into your general card/SNAP receipts line.
- Reimbursement lags the sale. SNAP is authorized instantly at checkout, but the store isn’t paid cash on the spot — the transaction is submitted to the state’s EBT processor and typically settles in two to three business days. That gap matters most right before a surge: if you buy inventory ahead of a predictable demand spike, you’re paying your supplier before you’ve collected the sale, and before you’ve been reimbursed for it.
- Reimbursement isn’t guaranteed to be routine. The 43-day federal government shutdown from October 1 to November 12, 2025 delayed and partially reduced SNAP payments nationally for the first time in the program’s history — several states, including Pennsylvania, New Jersey, Maryland, New York, and Texas, issued advance warnings that November benefits could stop entirely (CBS News, October 2025; CNBC, November 2025). That specific risk window has since passed: on September 2, 2026, a bipartisan continuing resolution was signed into law extending federal funding — and with it, SNAP and WIC issuance at current levels — through December 11, 2026 (Latin Times, September 2026). That pushes the next real funding cliff to December 11, 2026, and it’s worth calendaring as a genuine watch-date rather than treating the risk as resolved for the year. Separately, the 2025 federal reconciliation bill (the “One Big Beautiful Bill” Act) cut SNAP program spending by an estimated 20%, which one industry analyst estimated could shave 1.5–2% off overall grocery retail sales (CNBC). If SNAP is a significant share of your revenue, build both the recurring settlement lag and the recurring funding-deadline risk into your cash reserve sizing every budget cycle — not as a one-time note.
Compliance note: under the SNAP equal-treatment rule (7 CFR 278.2), a SNAP purchase has to be charged the same price as a cash purchase. If you run a cash-discount program to offset card processing fees, you cannot charge SNAP customers the higher, non-discounted price — that’s a compliance violation, not a pricing choice.
Card Settlement, Float, and Processing Fees
Card payments create two distinct cash flow effects, and it’s worth separating them because they call for different responses:
- Float (timing): debit and credit transactions authorize instantly but typically settle to your bank account one to two business days later, depending on your processor and network. On high-volume days — a holiday week, a big promotional weekend — that lag means your bank balance can trail your actual sales by a day or two, even with no SNAP exposure at all.
- Processing fees (margin, not timing): interchange and processor fees typically run 2–4% of the transaction, and on grocery’s thin margins that’s not a rounding error — a store running a 2.5% net margin that pays 2.8% in blended card processing costs is losing money on every card swipe before anything else hits the P&L. This isn’t a cash flow timing problem you can forecast around; it’s a cost that has to be priced into margins or negotiated down directly with your processor. Review your effective rate (total fees ÷ total card volume) at least annually, since blended rates drift as your card mix shifts toward higher-cost card types.
Match your vendor payment scheduling to your settlement calendar, not your sales calendar, or you’ll periodically look short on cash you’ve technically already earned — and budget the processing fee separately as a margin cost, not a timing gap.
Seasonal Cash Flow Patterns
Grocery has less seasonal swing than most retail, but it isn’t flat, and the department-level turnover data above tells you where each seasonal swing actually lands:
- Thanksgiving and December holidays — the biggest swing of the year, and it concentrates in the two slowest-turning departments (center store and general merchandise/seasonal) — exactly where excess inventory is already the most expensive to carry.
- Back-to-school — a smaller but real bump, mostly in packaged goods, so it behaves like the center-store turnover rate above, not like a produce-driven surge.
- Summer — a produce-driven volume increase, which is your fastest-turning department, so the cash-flow risk here is shrink from overbuying, not cash tied up for weeks the way a holiday general-merchandise overbuy would be.
Build purchasing and staffing plans around your own prior-year POS data by week, not a generic retail calendar. Grocery’s seasonal curve is flatter than apparel or general merchandise, and overcorrecting for a “holiday rush” that doesn’t materialize the same way ties up cash in the slowest-turning inventory on your shelf.
Building a Cash Reserve and Credit Line
A working capital reserve isn’t optional buffer money — it’s what covers the gap between paying a supplier and collecting on the sale, especially in the first 18 to 39 months before a new store reaches stable profitability. Size it against your actual settlement gaps, not a flat percentage of revenue:
Cash reserve target = (Worst realistic week of sales × card/SNAP settlement lag in days) + (Cost of one full inventory cycle)
For example, a store averaging $35,000 in weekly sales with a 3-day settlement lag and roughly $25,000 in cost tied up in a typical center-store inventory cycle needs a reserve in the neighborhood of $15,000–$40,000, depending on how much of that $35,000 runs through SNAP and card versus cash. Run the calculation off your own worst month, not your average one — the reserve exists for the weeks that don’t go as planned. This is a critical part of your grocery store business plan and helps determine how long until you’re profitable.
A revolving line of credit, sized against that same number, is the standard tool for the same job that stretched payables performs for a chain. If you’re carrying SBA debt already, note that a line of credit is a separate facility from your term loan — lenders underwrite it separately, typically against receivables and inventory rather than the fixed assets your original loan may have used as collateral. See our guide on how to get a small business loan for a grocery store.
Weekly Cash Flow Tracking
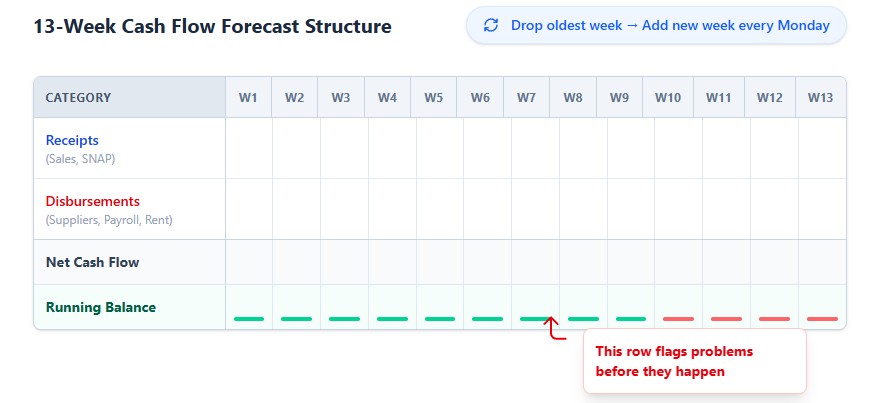
Monthly financials are too slow to catch a cash problem before it’s already a cash problem. A rolling 13-week cash flow forecast, updated weekly, is the standard tool for catching a shortfall while there’s still time to act on it. The structure is simple:
- One column per week, rolling 13 weeks forward, dropping the oldest week and adding a new one every Monday
- Receipts rows: card/cash sales (lagged 1–2 days to match settlement), SNAP reimbursement (lagged 2–3 days), WIC reimbursement (tracked separately, on its own settlement schedule), any other AR
- Disbursement rows: scheduled supplier payments by due date (not order date), payroll, rent, loan payments, sales tax remittance by its actual filing due date, other taxes
- Net cash flow row: receipts minus disbursements for that week
- Running cash balance row: prior balance plus that week’s net — this is the row that actually flags a problem before it happens
At minimum, also track DIO, DSO, and DPO monthly against your own trailing average, not an industry benchmark — the Kroger numbers above are a useful reference point for what leverage looks like at scale, not a target an independent store should expect to hit.
Frequently Asked Questions
Cash Flow Mistakes: How to Price the Impact for Your Own Store
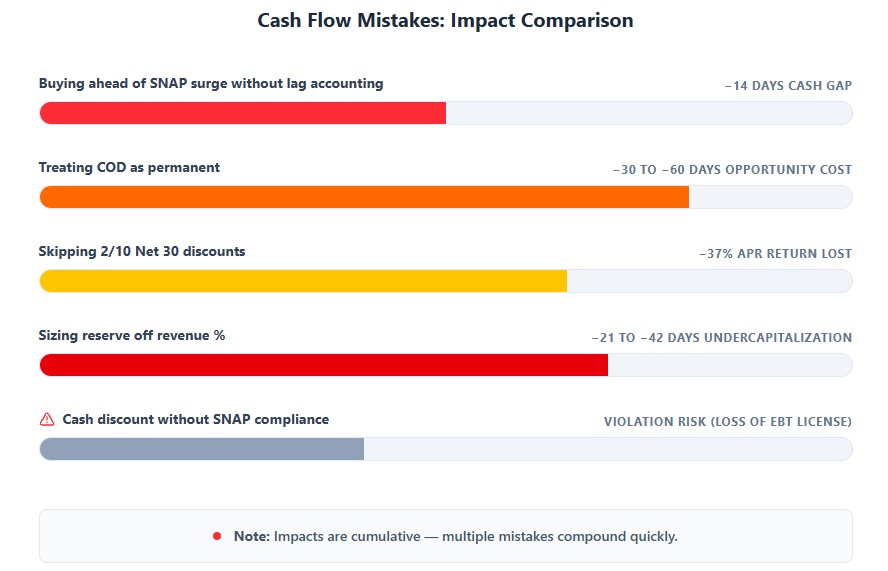
These five mistakes show up repeatedly, but their dollar impact is different for every store. Instead of treating them as a generic checklist, run each one against your own numbers using the quick calculation below it:
- Buying ahead of a SNAP surge without accounting for the reimbursement lag. Price it: multiply your SNAP share of weekly sales by your settlement lag in days ÷ 7. That’s roughly how many days of SNAP revenue are sitting uncollected the moment you place a surge order — compare that dollar figure to your current reserve.
- Treating COD terms as permanent instead of a stage. Price it: take your average weekly order value from your largest distributor and multiply by the number of weeks you’d gain on Net 15 or Net 30 versus COD. That’s the one-time cash unlock you’re leaving on the table by not asking.
- Skipping early-payment discounts because the cash looks tight in the moment. Price it: multiply your annual purchase volume with that supplier by 2% — that’s the yearly discount you’re forfeiting, against an effective ~37% APR-equivalent return on the cash you’d tie up for 20 fewer days.
- Sizing a cash reserve off total revenue instead of your actual settlement gaps. Price it: run the reserve formula above with your own numbers, then compare it to whatever flat percentage you’re currently using — the gap between the two is your real exposure.
- Running a cash-discount program without checking it against SNAP compliance. This one isn’t a sizing exercise — it’s a compliance violation under 7 CFR 278.2 the moment a SNAP customer is charged the non-discounted price, regardless of dollar amount, and it should be audited at the register level, not estimated.