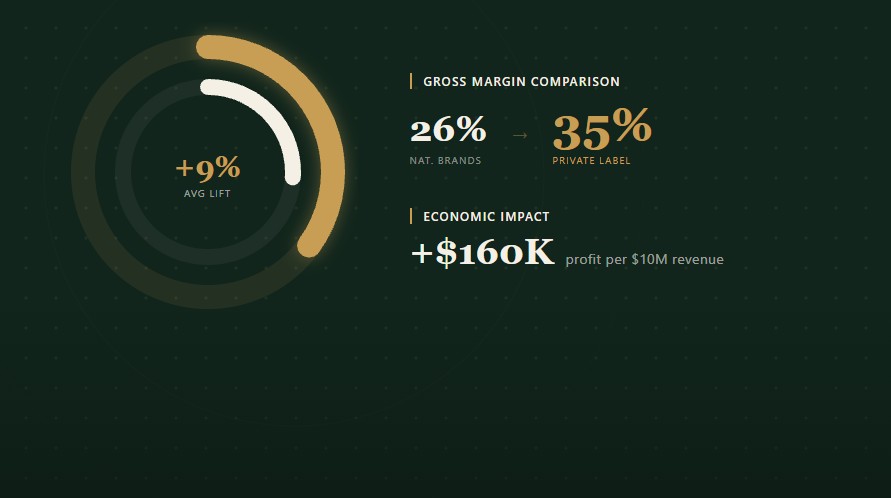
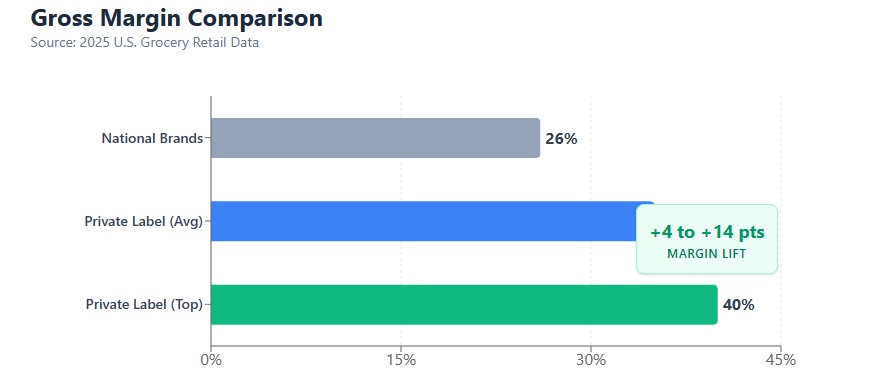
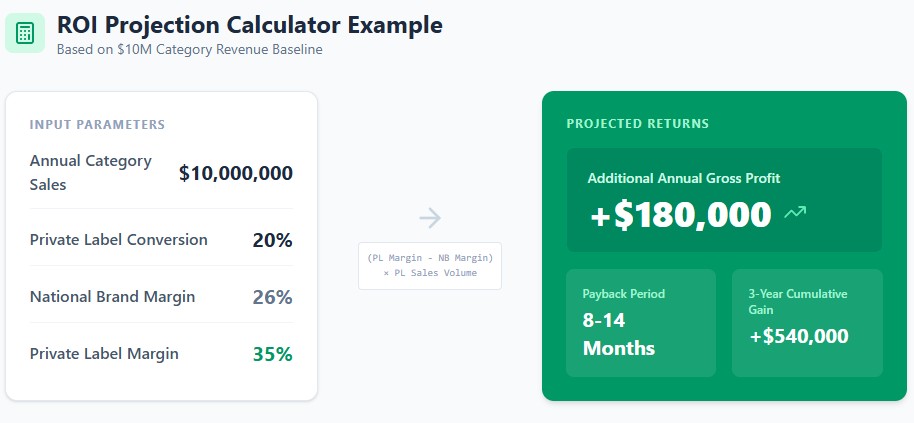
Private label means products under your brand instead of national brands like Coke, Kellogg’s, or Kraft. The economics are straightforward: national brands carry ~26% gross margins, while private label runs 30–40%. For a $10M grocer, shifting 20% of sales to private label adds $160,000–$200,000 in annual gross profit. This playbook walks through exactly how to launch or scale a private label program in 2026, based on proven approaches from Kroger, Costco, Aldi, and Trader Joe’s. Implementing a robust private label strategy is key to boosting these margins.
The Business Case: Why Private Label Now
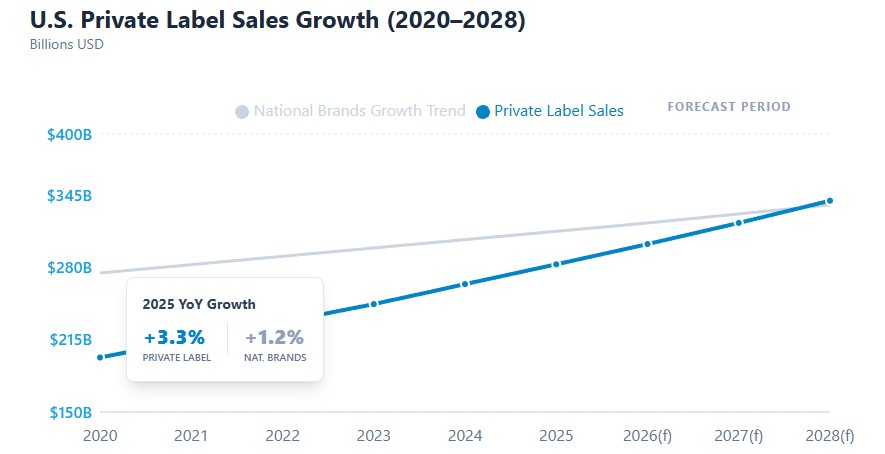
U.S. shoppers spent $282.8 billion on private label groceries in 2025, with dollar sales growing 3.3% while national brands grew just 1.2%, according to the Private Label Manufacturers Association. Store-brand unit sales rose 0.6% while national brand volume fell. This isn’t a recession blip — it’s a structural shift driven by three factors: (1) 72% of consumers can’t tell private label from national brands in blind tests (Deloitte Q3 2025 Retail Consumer Trends), (2) Gen Z rates private label quality higher than every other generation and will overtake Boomers in PL spending by mid-2026 (Numerator), and (3) private label has become a supply chain resilience tool, not just a margin play (Costco’s 2025 tariff hedging through regional Kirkland sourcing). Understanding your profit margins is crucial when evaluating this shift.
| Metric | National Brands | Private Label | Margin Lift |
|---|---|---|---|
| Typical Gross Margin | ~26% | 30–40% | +4 to +14 pts |
| U.S. Sales (2025) | $282.8B (+3.3% vs. +1.2% national brands) — Source: PLMA | ||
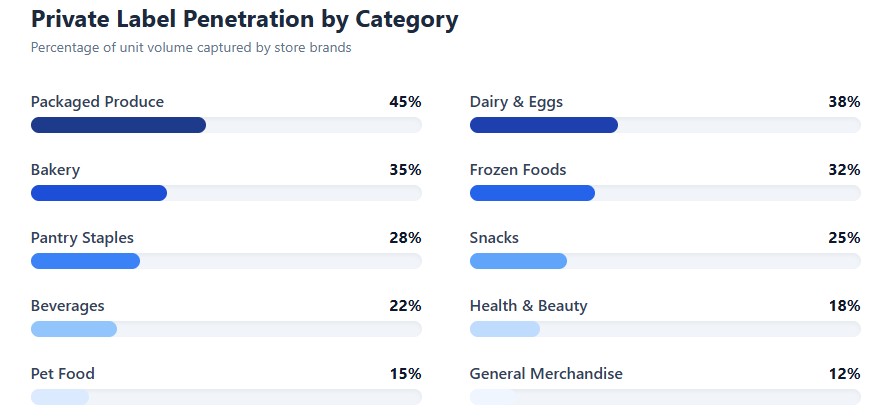
| Industry Penetration | 24–26% of unit volume (Aldi: 77–80%, Trader Joe’s: 69–80%, Costco: ~33%, Kroger: 22–23%) — Source: Statista, Numerator | ||
| International Context | U.S. at 24–26% vs. U.K./Western Europe at 50%+ — significant headroom for growth as European discount formats (Aldi, Lidl) continue U.S. expansion | ||
| Consumer Trust (2025) | 72% say PL = good alternative to name brands, 84% trust PL quality as much or more — Source: Deloitte Q3 2025, NielsenIQ | ||
| Break-Even Timeline | 4–5 months for $10M grocer launching 20 SKUs (see financial model below). Use our break-even analysis tools. | ||
Step 1: Pick 10–20 SKUs to Start (Don’t Boil the Ocean)
The biggest mistake operators make is launching 50+ SKUs at once. Start with 10–20 SKUs in categories where brand loyalty is low and quality is indistinguishable from national brands. Test in 3–5 stores for 90 days. Track sell-through weekly. Kill underperformers fast (anything <70% sell-through in 90 days). Scale winners to full chain. Monitoring your inventory turnover ratio is essential during this testing phase.
Best Categories for Private Label (Start Here)
| Category | Why It Works | Target Gross Margin | Example SKUs |
|---|---|---|---|
| Milk, Eggs, Butter | Commodity purchase, zero brand loyalty, shoppers know “right” price | 30–35% | Whole milk (gallon), Large eggs (dozen), Unsalted butter (1 lb) |
| Paper Towels, Toilet Paper | No functional differentiation, price-driven purchase | 32–38% | Paper towels (6-roll), Bath tissue (12-roll) |
| Frozen Vegetables | Quality indistinguishable from national brands after cooking | 35–40% | Frozen broccoli, Mixed vegetables, Green beans |
| Canned Goods (Tomatoes, Beans) | Processing standardizes quality, long shelf life reduces waste risk | 32–38% | Diced tomatoes (14.5 oz), Black beans (15 oz), Chickpeas (15 oz) |
| Organic/Natural Products | Trust in USDA Organic certification, not brand name | 35–42% | Organic quinoa, Organic almond butter, Organic pasta |
Categories to Avoid (For Now)
| Category | Why It’s Hard | Exception |
|---|---|---|
| Snacks (Chips, Cookies) | Lay’s, Oreos = decades of brand equity, taste preference = emotional | Private label works only if genuinely differentiated (e.g., unique flavors, better ingredients) |
| Cereal | Cheerios, Frosted Flakes = childhood nostalgia, habit-driven | Avoid unless you can match taste/texture exactly (rare) |
| Condiments (Ketchup, Mustard) | Heinz = flavor benchmark, hard to replicate without R&D investment | Only if you co-develop with experienced condiment co-packer (6–9 month timeline) |
| Wine, Craft Beer | Region, vineyard, brewery = key purchase drivers, not price | Private label wine works for entry-level table wine, not premium |
Advanced: AI-Driven SKU Selection (What Kroger 84.51° Does)
Kroger’s data science subsidiary, 84.51°, uses predictive analytics to identify which specific SKUs are ready for private label conversion before launch — not by trial and error. Here’s how to replicate this without a dedicated data team:
- Loyalty card analysis: Identify households that buy national brands but also buy your existing PL in adjacent categories. These are “PL-ready” shoppers.
- Price elasticity modeling: Test small price increases on national brands in low-loyalty categories. If volume doesn’t drop, shoppers are price-sensitive and PL-ready.
- Third-party data: Services like Numerator and Circana provide category-level brand switching data — identify categories where shoppers already switch between national brands frequently (low loyalty = PL opportunity).
- Basket affinity analysis: Which national brand SKUs are frequently purchased together with your existing PL? Those are candidates for PL conversion (shopper already trusts your brand in that basket).
Step 2: Find Suppliers (3 Options)
Three ways to source private label exist. Your choice determines margin ceiling, speed to market, and long-term quality perception. The mistake most emerging retailers make is defaulting to white-label because it’s fastest, then wondering why their store brand gets the exact “generic” reception Trader Joe’s and Aldi spent two decades escaping. Quality perception isn’t accidental — it’s downstream of which sourcing model you choose before a single unit is produced.
Sourcing Options Compared
| Option | Time to Market | MOQ Required | Unit Cost (Example) | Margin Potential | Best For |
|---|---|---|---|---|---|
| White Label (off-the-shelf formula, your branding) |
4–8 weeks | 100–500 units | $2.50–$3.50 | 25–30% | Fast entry, low differentiation categories (paper goods, basic canned goods) |
| Co-Packing (joint formula development) |
3–5 months | 1,000–3,000 units | $2.00–$2.50 | 30–35% | Mid-market balancing risk and speed (frozen vegetables, organic products) |
| Contract Manufacturing (full custom spec, your tech pack) |
6–9 months | 5,000–10,000 units | $1.50–$2.00 | 35–40% | Scale, long-term quality strategy (signature products, premium tiers) |
Source: PLMA supplier guidelines, Food Business News
Where to Find Suppliers
| Resource Type | Examples | What You Get |
|---|---|---|
| Industry Directories | PLMA Supplier Exchange, Food Processing Supplier Show | Searchable database of 1,000+ co-packers by category, certification, MOQ |
| Trade Shows | Private Label Trade Show Chicago (November annually), IFT FIRST (July annually) | Meet 50–100 suppliers in 2 days, sample products, negotiate MOQs on-site |
| Vetting Process | Request quotes from 5–10 suppliers per category | Compare MOQs, lead times, certifications (SQF Level 2+, BRC Grade A+, FDA-registered) |
| Facility Audits | Third-party audits (SQF, BRC) + quarterly visits | Verify food safety, quality control, labor practices, capacity to scale 2–3x |
Step 3: Price Before You Formulate (Critical Mistake to Avoid)
Most retailers formulate first, then try to price. This fails. You end up with a product that costs $2.50/unit to make, but the competitive shelf price is $3.99, leaving you 22% margin instead of 35%. Do the opposite: price backward from target shelf price, then ask co-packer if they can hit your cost target. Understanding your COGS is critical here.
Pricing Workflow (Do This First)
| Step | Calculation | Example: Organic Pasta (16 oz) |
|---|---|---|
| 1. Set target shelf price | Competitive with national brands or 10–15% below | $3.99 |
| 2. Subtract retailer gross margin (35%) | Shelf price × 0.35 = your margin | -$1.40 → $2.59 remaining for landed cost |
| 3. Subtract packaging | Box, label, shrink wrap | -$0.25 → $2.34 remaining |
| 4. Subtract freight/logistics | Inbound freight, warehouse handling | -$0.15 → $2.19 remaining |
| 5. Subtract waste buffer (10–15%) | Early-run waste, returns, spoilage | -$0.10 → $2.09 remaining |
| 6. Ask co-packer | Can you produce at $2.09/unit with 10–15% margin? | If yes → proceed. If no → raise shelf price to $4.29 or kill SKU. |
Step 4: Navigate Regulatory Requirements (State-by-State)
Private label isn’t just sourcing and pricing — you’re now a food manufacturer in the eyes of regulators. Requirements vary by state and product category. Here’s what to expect. Ensure you review our guide on grocery store licensing & permits.
Regulatory Requirements by Product Type
| Product Category | Federal Requirements | State Requirements (Varies) | Timeline |
|---|---|---|---|
| Dairy (Milk, Butter) | FDA registration, Pasteurized Milk Ordinance (PMO) compliance | State dairy inspection (CA: CDFA, NY: AGM, TX: TDA), milk dealer license | 2–3 months for approvals |
| Eggs | FDA Egg Safety Rule, USDA grading (optional) | State egg handler license, refrigeration requirements | 1–2 months |
| Frozen Foods | FDA registration, HACCP plan | State food processing license, cold chain documentation | 2–3 months |
| Canned Goods (Acidified) | FDA registration, Better Process Control School (BPCS) certification | State food processing license, product filing (CA: CDFA, NY: DOH) | 3–4 months (BPCS course required) |
| Organic Products | USDA Organic certification (via accredited certifier), NOP compliance | State organic program (CA: CCOF, TX: TDA), annual inspections | 3–6 months for initial certification |
| Natural/Non-GMO | Non-GMO Project verification (optional), FDA labeling compliance | Federal Bioengineered Food Disclosure Standard preempts state laws (VT H.112 was effective 2016, preempted by S.764 July 2016) | 1–2 months for verification |
Sources: FDA Food Code, USDA National Organic Program, USDA Bioengineered Food Disclosure Standard
Labeling Requirements (Federal + State)
| Requirement | Federal (FDA/USDA) | State-Specific |
|---|---|---|
| Statement of Identity | Product name (e.g., “Organic Whole Milk”) | Some states require specific wording (CA: “Grade A”) |
| Net Quantity | Weight/volume in oz + metric (e.g., “16 oz (454g)”) | Consistent across states |
| Ingredient List | Descending order by weight, allergen declaration | CA: Prop 65 warning if applicable (lead, cadmium, etc.) |
| Nutrition Facts | FDA-compliant panel (2021 format) | Consistent across states |
| Manufacturer/Distributor | “Distributed by [Your Company, City, State, ZIP]” | Some states require street address, not just ZIP |
| Organic Claims | USDA Organic seal + certifier name (e.g., “Certified Organic by CCOF”) | CA, TX, NY: Additional state organic program registration |
Step 5: Financial Projections (What to Expect)
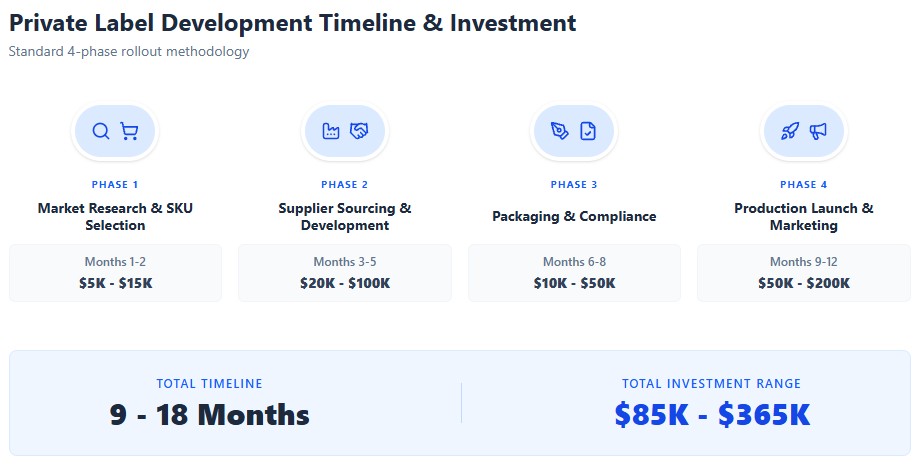
Illustrative financial model for a $10M independent grocer launching 20 private label SKUs. Substitute your own numbers for actual business planning. Based on PLMA industry benchmarks and independent grocer financial data. This should be part of your overall business plan.
Initial Investment
| Cost Component | Amount | Notes |
|---|---|---|
| Packaging design (20 SKUs) | $20,000 | $1,000/SKU for dieline, graphic design, regulatory review |
| Co-packer setup fees | $7,500 | $375/SKU average (varies by complexity) |
| MOQ inventory (20 SKUs × 1,000 units × $2/unit) | $40,000 | Assumes co-packing model, $2.00 average landed cost |
| Testing & certifications (SQF, lab analysis) | $4,000 | Microbial testing, allergen testing, nutrition panel verification |
| Total Initial Investment | $71,500 | One-time, before first unit sells |
Monthly Economics (Steady State, Month 6+)
| Metric | Amount | Assumptions |
|---|---|---|
| Store revenue (baseline) | $833,000 | $10M annual revenue ÷ 12 months |
| Private label sales (20% penetration) | $167,000 | 20% of $833K monthly revenue |
| Private label gross margin (35%) | $58,450 | 35% PL margin on $167K |
| Gross margin on national brands (26%, on $666K) | $173,160 | Remaining 80% of sales at 26% margin |
| Blended gross margin with PL | $231,610 (27.8%) | Weighted average: (20% × 35%) + (80% × 26%) |
| Gross margin if 100% national brands (26% on $833K) | $216,580 (26.0%) | Baseline scenario (no private label) |
| Monthly margin lift from PL | $15,030 | $231,610 – $216,580 = incremental gross profit |
Break-Even & ROI
| Metric | Value | Calculation |
|---|---|---|
| Break-even timeline | Month 5 | $71,500 initial investment ÷ $15,030/month margin lift |
| Year 1 private label revenue | $1.0M | Ramps from 0% to 20% over 12 months on $10M base (average 10% penetration Year 1) |
| Year 1 gross profit lift | $90,000 | Blended margin lift (1.8 pts) × $1.0M PL revenue |
| Year 1 net gain (after initial investment) | $18,500 | $90,000 lift – $71,500 investment |
| Year 1 ROI | 26% | ($18,500 ÷ $71,500) × 100 |
| Year 2 ROI (steady state) | 252% | $180,360 annual lift ÷ $71,500 investment (no repeat of initial capex) |
Note: Based on PLMA industry margin benchmarks. Actual results vary by category mix, supplier terms, and local market conditions. Year 1 assumes linear ramp from 0% to 20% penetration (average 10% Year 1). Year 2 assumes full 20% penetration maintained.
Real-World Case Studies: What Went Wrong
| Case | What Happened | Lesson |
|---|---|---|
| Regional chain, 50 SKUs (2023) (Illustrative scenario based on industry benchmarks) |
Launched 50 private label SKUs in 2023, overestimated demand by 40%. Result: approximately $180,000 in write-offs (18 months of PL profit erased in one quarter). | Start with 10–20 SKUs, not 50. Test 90 days before full rollout. Maintain 10–15% safety stock buffer, not 40% overestimation. |
| Listeria recall, packaged salads (January 2024) (BrightFarms — FDA recall notice, 7 states) |
BrightFarms recalled 5 packaged salad and slaw products due to Listeria monocytogenes contamination risk. Products sold under BrightFarms brand at Giant, Giant Food, Food Lion, Stop & Shop, and Wegmans across Connecticut, Massachusetts, New York, New Jersey, Pennsylvania, Virginia, and West Virginia. Single co-packer failure affected multiple retail customers simultaneously. | Require SQF/BRC certification. Test every batch. Have crisis communication plan ready (recall protocol, customer notification, media response). Diversify co-packers — single supplier failure can disrupt multiple retailers at once. |
| Target Market Pantry (2015–2020) (Reported by Modern Retail) |
Market Pantry struggled for years because it was perceived as “cheap copy” rather than “quality alternative.” Only after 2020 reformulation (better ingredients, cleaner packaging) did PL penetration improve. | Don’t just undercut on price. Invest in genuine differentiation. Packaging signals quality or discount — choose deliberately. |
Step 6: Manage Risks (What Can Go Wrong)
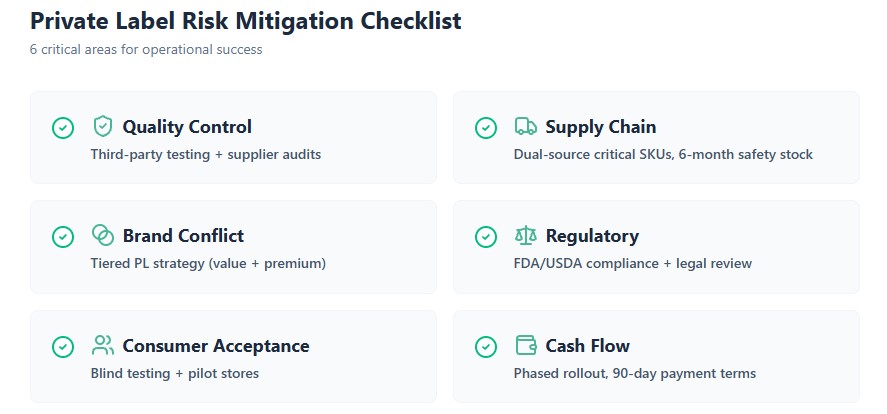
Private label isn’t free upside. Four risks dominate: inventory liability, recall exposure, supplier concentration, and “cheap copy” perception. Here’s how to mitigate each. Effective cash flow management is vital to handle these risks.
Risk Matrix
| Risk | Impact | Likelihood | Mitigation |
|---|---|---|---|
| Inventory liability (unsold stock) |
100% your capital at risk (vs. 10–20% recovery on national brand returns) | High (40% of new PL SKUs fail in Year 1) | Start with 10–20 SKUs, test 90 days, kill anything <70% sell-through. Maintain 10–15% safety stock, not 40% overestimation. |
| Recall/quality failure | Reputational hit on YOUR brand (no manufacturer buffer), 3% sales decline for 6 months post-recall | Medium (1–2% of PL SKUs recalled annually) | Require SQF Level 2+ or BRC Grade A+ certification. Conduct quarterly audits. Test every production batch for pathogens, allergens, label accuracy. |
| Supplier concentration | Single co-packer failure = 20–30% of PL assortment gone overnight | Medium (plant closures, labor disputes happen) | No supplier >30% of PL volume. Diversify across 3–5 suppliers per category. Maintain backup supplier relationships even if not actively used. |
| “Cheap copy” perception | Erodes trust, doesn’t build loyalty, caps penetration at 10–15% | High (most new PL programs default to value-tier packaging) | Invest in genuine differentiation (better ingredients, unique formulations). Use “quiet luxury” packaging (matte finish, muted colors, ingredient transparency). Avoid loud “SAVE $2” callouts. |
How Leaders Do It (Case Studies, Not “Models”)
Four retailers dominate private label: Kroger, Costco, Aldi, Trader Joe’s. Each uses a different approach. None is “the model” — they match private label strategy to format economics. Here’s what each does and what’s replicable for conventional grocers.
Kroger: Category Precision (Replicable for Conventional Grocers)
| Metric | Value | Source |
|---|---|---|
| PL share of sales | 22–23% ($30B+, 13,000+ SKUs) | Kroger 10-K FY2024 |
| PL gross margin | ~35% (vs. 26% national brands) | Kroger investor calls, Cincinnati CPG Edge |
| Household penetration | 90%+ buy at least one Our Brands item annually | Supermarket Perimeter |
| Our Brands tiers | 4: Premium (Private Selection), Mainstream (Kroger), Value (Smart Way/Big K), Specialty (Simple Truth) | Kroger 10-K |
Approach: Category-by-category audit instead of blanket expansion. As of 2025 investor calls, Kroger executives said they were one-third to 40% through a full category audit — asking whether each category needs an opening price point, a premium push, or should remain national-brand-dominated. This is the only proven playbook for conventional supermarkets because it works within existing cost structures and customer expectations.
Costco: Membership-Funded Parity (Partially Replicable)
| Metric | Value | Source |
|---|---|---|
| PL share of sales (Kirkland Signature) | ~33% (~$90B in 2025) | Costco investor materials, industry estimates |
| Markup cap | 15% on Kirkland (vs. 14% on national brands) | Massively Moats analysis, Costco disclosures |
| Pricing target | 20% below national brands, quality-matched | Costco member value positioning |
| Membership fees as % of operating income | ~51% (FY2025), ~35-40% (FY2023) | Costco 10-K, Longyield analysis, FourWeekMBA |
Approach: Same manufacturers as national brands (Duracell makes Kirkland batteries, Starbucks roasts Kirkland coffee, Huggies/Jelly Belly facilities produce Kirkland lines). Membership fees fund ~50% of operating income → can sacrifice merchandise margin for member value. In 2025, Costco used Kirkland as a tariff hedge, shifting laundry-product sourcing to regional Asian manufacturing for Asia-Pacific warehouses, cutting member prices by 40% in those markets.
Replicable for conventional grocers: Sourcing model (same manufacturers as national brands), but not membership-funded pricing (you don’t have membership fee buffer).
Aldi: Factory-Direct Catalog (Not Replicable for Conventional Grocers)
| Metric | Value | Source |
|---|---|---|
| PL share of sales | 77–80% | Statista, Numerator |
| SKUs per store | 1,400–1,600 (vs. 30,000+ conventional) | Aldi corporate disclosures |
| Operating margin | 3–4% (vs. 1.5–2% conventional) | Industry benchmarks, Massively Moats |
| Inventory turnover | 18–22x annually (vs. 12–14x conventional) | ALDI vs. Traditional Supermarkets Efficiency Study |
Approach: Direct factory contracts, no intermediaries. Massive volume per SKU = negotiating power. SKU reduction eliminates 60% of conventional store labor (no shelf stocking from 30,000 items).
Not replicable for conventional grocers: Existing lease structures require 30,000+ SKU assortments. National brand contracts include minimum purchase commitments. Customer base expects brand choice (Coke, Doritos, Cheerios). This is a format strategy, not a private label strategy.
Trader Joe’s: Exclusivity Platform (Not Replicable Without Format Reinvention)
| Metric | Value | Source |
|---|---|---|
| PL share of sales | 69–80% (unit vs. dollar) | Numerator, industry estimates |
| SKUs per store | ~4,000 (vs. 30,000+ conventional) | Trader Joe’s corporate disclosures |
| PL gross margin | 35–40% (highest in industry) | Industry benchmarks, Massively Moats |
| Revenue per store | $15–20M annually (vs. $8–12M conventional) | Wikipedia, Numerator |
Approach: Zero national brands in core categories. Products are genuinely differentiated (Everything But the Bagel Seasoning, Unexpected Cheddar). No price comparison possible (can’t buy TJ’s products elsewhere). Cult following allows premium pricing despite private label status.
Not replicable without format reinvention: Requires complete assortment overhaul (removing national brands) and in-house product development team (TJ’s has 100+ food scientists). Took 50+ years to build brand equity.
2026–2028: What’s Changing (And What You Should Do About It)
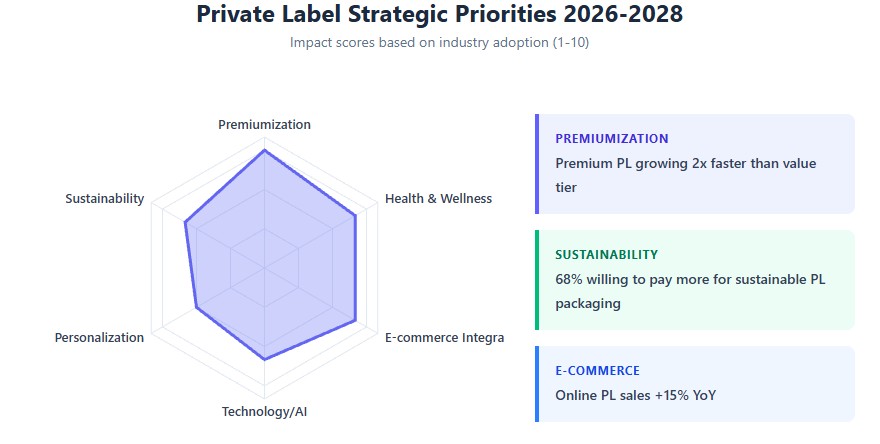
Three shifts will define private label strategy over the next 24–36 months. Each creates opportunity for operators who prepare now.
Three Shifts to Watch
| Trend | What It Means | Action (Do This Now) | Timeline |
|---|---|---|---|
| Gen Z overtaking Boomers in PL spending (by mid-2026) |
Private label no longer = “budget option for older shoppers.” Gen Z rates PL quality higher than every other generation (Circana), and Numerator projects Gen Z’s share of PL spending will overtake Boomers by mid-2026. | Develop premium/specialty tiers (organic, clean label, sustainable packaging). Avoid value-tier-only strategy. Market to values (sustainability, transparency), not price. | Mid-2026 inflection point |
| Tariff hedging through regional sourcing | Private label is now a supply chain resilience tool, not just a margin play. Costco’s 2025 shift of Kirkland laundry products to regional Asian manufacturing for Asia-Pacific warehouses (cutting member prices by 40%) is the blueprint. | Map your private label supplier base by geography. If >50% of SKUs come from a single country (e.g., China), develop backup co-packers in alternative regions (Mexico for U.S. retailers, Eastern Europe for EU). | 2026–2027 (peak tariff impact April–October 2026) |
| “Quiet luxury” packaging | 72% of consumers can’t tell private label from national brand in blind tests (Deloitte Q3 2025). Packaging’s job is no longer “prove you’re worth trying” — it’s “signal you belong on this shelf.” | Adopt “quiet luxury” design language: matte finish, muted colors (sage green, ivory, champagne tones), clean sans-serif type, ingredient transparency. Avoid loud “SAVE $2” callouts — they signal you’re still playing the old game. | 2026–2028 (packaging refresh cycles) |
Emerging Trends: What Competitors Aren’t Covering (Yet)
Five developments are reshaping private label strategy in 2025–2026. None are covered in existing guides — these are white space opportunities for operators who move first.
1. Retail Media + Private Label: The Double Monetization Play
Kroger Precision Marketing, Walmart Connect, and Instacart Ads now sell advertising space to national brands next to private label products on digital shelves. This creates a new revenue stream built on top of PL penetration data:
- How it works: Your private label gains share in a category → national brands (PepsiCo, Kraft Heinz) pay you for sponsored search slots, banner ads, and “featured product” placements to defend their position.
- Economics: Retail media operates at 50–75% operating margins (vs. 1.5–2% on food). Kroger Precision Marketing grew >20% in Q1 FY2026, driven by advertiser demand to reach PL-switching shoppers.
- Strategic implication: Private label isn’t just a margin play anymore — it’s a tool to monetize national brand defense spending. The more PL share you gain, the more advertisers pay to reach those shoppers.
2. Online vs. Offline: Different Discovery Patterns
In physical stores, shoppers see national brands and private label side-by-side on the same shelf — enabling the “72% can’t tell the difference” dynamic. In e-commerce (Instacart, Amazon Fresh), this visual comparison disappears:
- Offline: Visual adjacency → price/quality comparison → PL wins on value perception.
- Online: Search-driven discovery → shoppers search by brand name (“Lay’s chips”) not category (“potato chips”) → PL gets buried in search results.
- Action: Optimize PL for algorithmic discovery: “frequently bought together” placements, sponsored search within your own app/website, and SEO-optimized product titles (not just “Our Brand Potato Chips” but “Our Brand Kettle Cooked Potato Chips, Sea Salt, 8 oz”).
3. National Brand Counterattack (2025–2026)
Large CPG companies (General Mills, Kraft Heinz, Conagra) are no longer passive victims of PL growth. They’re adapting:
- Value sub-brands: National brands launching lower-price tiers to compete with PL on price without cannibalizing core brand equity.
- Co-manufacturing deals: Some CPGs now manufacture private label products for retailers — capturing margin from PL growth instead of losing it entirely.
- Implication for 2027–2028: PL growth will face more sophisticated resistance. The “low-hanging fruit” categories (dairy, paper, frozen) are already contested. Next wave requires genuine differentiation, not just price undercutting.
Decision Checklist: Go or No-Go?
Private label is the highest-margin lever in grocery retail, but it’s not for every operator. Use this checklist to decide whether to launch, scale, or hold.
Launch Private Label If:
| Criterion | Threshold | Why It Matters |
|---|---|---|
| Available capital | $75,000–$150,000 | Covers packaging, MOQs, testing, certifications. Less = undercapitalized, more = overcommitting before proof of concept. |
| National brand gross margin | <28% | If you’re already at 28%+ on national brands, private label lift is smaller. Private label adds 4–14 pts — bigger lift if starting from 22–26%. |
| POS data history | 3+ years | Need enough data to identify low-brand-loyalty categories, seasonal patterns, price elasticity. |
| Timeline commitment | 6–9 months | Sourcing, testing, certifications, packaging design can’t be rushed without quality/safety tradeoffs. |
| QA capability | In-house lab or third-party access | Every batch needs microbial, allergen, and label accuracy testing. Can’t outsource this entirely. |
Don’t Launch Private Label If:
| Red Flag | Risk | Alternative |
|---|---|---|
| Doing it only to compete with Aldi/Walmart on price | You’ll lose. They have scale you can’t match. Private label becomes race to bottom. | Focus on differentiation (local sourcing, specialty categories, customer experience) instead of price-matching. |
| Can’t absorb $50,000–$200,000 potential write-offs | One bad launch (40% overestimation) = 18 months of PL profit erased. Can your balance sheet handle it? | Start with 5–10 SKUs, not 20–50. Reduce capital at risk. |
| Customer base highly brand-loyal | Craft beer, specialty snacks, condiments = emotional attachment to national brands. | Focus on low-loyalty categories (dairy, paper, frozen) first. Build trust before expanding. |
Scale Private Label If:
| Green Light | Threshold | Rationale |
|---|---|---|
| Current PL penetration | <15% of sales | Industry average is 24–26%. Room to grow before diminishing returns. |
| PL gross margin | >32% | Proves sourcing model works. If <30%, fix sourcing before scaling. |
| Sell-through on test SKUs | >85% in first 90 days | Proves product-market fit. Anything <70% = kill, don’t scale. |
| Co-packer capacity | Can scale 2–3x without quality degradation | Verify co-packer has equipment, labor, raw materials to handle 2–3x volume. |
Don’t Scale Private Label If:
| Warning Sign | Risk | Fix First |
|---|---|---|
| PL penetration already >30% | Diminishing returns. Next 10% harder than first 20%. | Optimize existing SKUs (reformulate, repackage, repricing) before adding new ones. |
| PL gross margin <30% | Sourcing model is broken (white-label trap, poor negotiation). | Renegotiate with co-packers, switch to contract manufacturing, or raise shelf prices. |
| 2+ quality issues or recalls in past 12 months | Systemic QA failure. Scaling amplifies risk. | Pause scaling. Fix QA processes, audit all co-packers, retest all SKUs. |
| Co-packers at >80% capacity | Risk of stockouts or quality slips (cutting corners to meet demand). | Qualify backup co-packers before scaling. Diversify across 3–5 suppliers per category. |