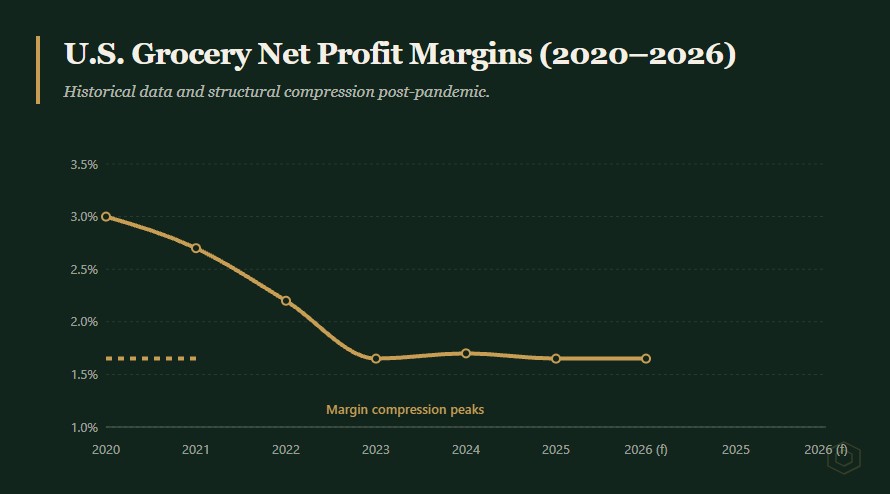
Conventional supermarkets in the United States operate on net profit margins of 1.5% to 2.5%, with the industry average at 1.7% as of 2025–2026. This represents one of the lowest-margin sectors in retail, where operational efficiency and scale determine survival. Understanding these dynamics is crucial for any grocery store business plan.
“Even operating margins, which exclude taxes and some one-time costs, are stuck around 2%. Any misstep – a pricing error, a supply chain hiccup, a labor cost increase – can quickly erode those margins.” — Analysis of Kroger’s financial position, MMCgInvest (2026)
Profit Margins by Store Format
Different grocery business models achieve substantially different profitability levels based on their operational structure, target customer, and competitive positioning.
Net Profit Margins Across Store Types (2025–2026)
| Store Format | Net Profit Margin | Gross Margin | Key Characteristics |
|---|---|---|---|
| Conventional Supermarkets (Kroger, Albertsons, Safeway) |
1.5%–2.5% | 23%–28% | Full-service, 25,000–50,000 SKUs, compete directly on price with discount formats, high labor costs from service departments |
| Discount Supermarkets (Walmart, Aldi) |
2.5%–4.0% | 20%–25% | Limited assortment (Aldi ~1,500 SKUs), 90%+ private label at Aldi, operational efficiency, smaller store footprint |
| Warehouse Clubs (Costco, Sam’s Club) |
2.0%–3.0% | 11%–15% | Membership model (~50% of Costco operating income from fees in FY2025), bulk purchasing, ~4,000 SKUs, deliberate margin caps |
| Specialty/Organic (Whole Foods, Sprouts, Trader Joe’s) |
4.0%–6.5% | 35%–40% | Less price-sensitive customers, premium pricing (20–40% above conventional), curated assortment, Sprouts achieves 39% gross margin |
| Independent/Regional Grocers | 1.0%–3.0% | 25%–30% | No scale advantage, higher wholesale costs, limited technology investment, well-run stores in underserved markets can reach 3%–5% |
| Dollar Stores with Grocery (Dollar General, Family Dollar) |
3.0%–5.0% | 30%–35% | Small-format, limited fresh, high convenience pricing, rural/underserved markets |
Data Notes: Figures represent trailing 12-month averages for 2025–2026. Public company data from SEC filings; private company estimates from industry reports.
What Drives the Variation
Lower-margin formats (conventional supermarkets) face direct price competition from Walmart and Aldi, full cost of labor-intensive departments (meat, deli, bakery at 15%–50% labor as percent of sales), and higher shrink on fresh categories. Learn more about shrinkage in grocery stores.
Higher-margin formats (specialty, discount) benefit from less price-sensitive customer bases or operational efficiency, private label dominance capturing 25–35% higher margins than national brands, and reduced complexity from fewer SKUs and limited service departments. Implementing a robust private label strategy is key to boosting these margins.
Grocery Store Profit Margin Calculator
Regional Profit Margins by State
Operating economics vary significantly by geography due to differences in labor costs, real estate prices, competition density, and local market dynamics. Deciding whether to buy or lease commercial real estate will also impact your regional cost structure.
State-by-State Net Margin Estimates (2025–2026)
| State/Region | Estimated Net Margin | Primary Factors |
|---|---|---|
| Southeast (FL, GA, TN, NC, SC) |
2.0%–3.0% | Lower labor and occupancy costs, population growth, moderate competition, strong independent grocer presence |
| South Central (TX, OK, AR, LA) |
2.0%–2.8% | No state income tax (labor cost advantage), growing markets, Walmart/Albertsons dominance keeps pricing competitive |
| Midwest (OH, IN, MI, IL, WI, MN) |
1.5%–2.3% | Moderate costs, mature markets, Kroger/Albertsons strong presence, rural independents at lower end |
| Mountain West (CO, UT, AZ, NV) |
1.8%–2.5% | Growing population, King Soopers/Kroger dominance, specialty grocers (Whole Foods, Sprouts) perform well |
| Pacific Northwest (WA, OR) |
1.5%–2.2% | Higher labor costs (minimum wage $15–$17/hour), strong union presence, QFC/Fred Meyer/Kroger market |
| California | 1.3%–2.0% | Highest labor costs in U.S. ($16–$20/hour minimum), strict regulations, intense competition (Walmart, Aldi, Sprouts, Whole Foods, regional chains) |
| Northeast (NY, NJ, MA, CT, PA) |
1.2%–2.0% | Highest occupancy costs, strong union labor, intense competition (Wegmans, Stop & Shop, Kroger, Aldi), Price Chopper/Market Basket pressure |
| Mid-Atlantic (VA, MD, DE) |
1.6%–2.3% | Suburban wealth supports higher margins, but DC/Baltimore competition intense, Kroger/Giant/Ahold presence |
| Alaska/Hawaii | 1.0%–2.0% | Extreme logistics costs, limited competition (can support higher pricing), small market size limits scale |
Data Notes: State-level margins are estimates based on regional operator performance, labor cost data, and competitive landscape analysis. Individual store performance varies significantly within states.
Regional Performance Patterns (2025 Data)
According to the National Grocers Association’s 2025 independent grocer study, South and West regions produced the strongest profitability results among independent operators, while the Northeast region continued to face higher labor and occupancy costs alongside intense competitive pressure. Total store gross margin for independents increased from 27.4% to 27.9% year-over-year, with net profit before taxes at 2.20% (up from 1.90%).
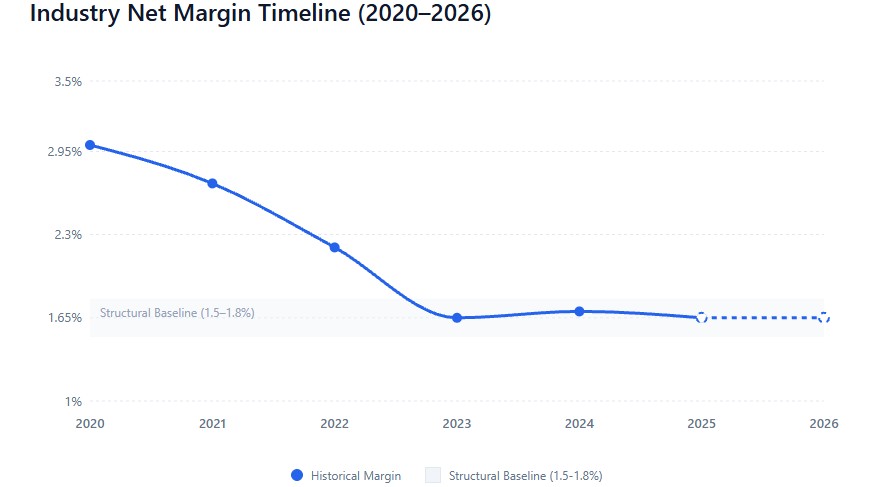
Historical Margin Trends (2020–2026)
Grocery profit margins have experienced significant volatility over the past six years, driven by pandemic demand shifts, inflation, competitive dynamics, and emerging external shocks.
Industry Net Margin Timeline
| Year | Average Net Margin | Key Drivers |
|---|---|---|
| 2020 | 2.8%–3.2% | Pandemic demand spike, reduced shrink from lower foot traffic, government stimulus supporting consumer spending |
| 2021 | 2.5%–2.9% | Continued strong demand, but rising labor costs (+15–20% wage inflation) and supply chain disruptions begin pressuring margins |
| 2022 | 2.0%–2.4% | Inflation accelerates (food CPI +10–12%), costs rise faster than retailers can pass through, consumers begin trading down |
| 2023 | 1.5%–1.8% | Margin compression peaks, discount formats (Aldi, Lidl, Dollar General) gain share, private label adoption accelerates |
| 2024 | 1.6%–1.8% | Stabilization begins, retail media and private label offset some pressure, but “affordability era” limits pricing power |
| 2025 | 1.6%–1.7% | New baseline established, conventional supermarkets at 1.5–1.8%, discount/specialty formats outperform at 3–6%; tariff impacts begin absorbing ~80% of costs through margin compression |
| 2026 (Forecast) | 1.5%–1.8% | Continued discount competition, modest improvement for chains scaling retail media/private label, tariff pass-through to consumers accelerating (expected to drop to ~20% retailer absorption by end-2026), consolidation pressure on small independents |
Context: The 3%+ margins of 2020 were an anomaly driven by unprecedented demand and reduced operational friction. The 1.5% to 1.8% range of 2024–2026 represents the structural baseline for conventional supermarkets. Trade tariffs introduced in 2025 are expected to have their peak impact on shelf prices during April–October 2026, with particular pressure on imported produce (tomatoes, avocados, berries from Mexico at up to 25% tariff rates).
Category-Level Margin Structure
Grocery stores manage profitability at the category level, not the individual SKU level. Each department serves a specific strategic role in the overall margin architecture. Understanding your unit economics and profit centers is essential here.
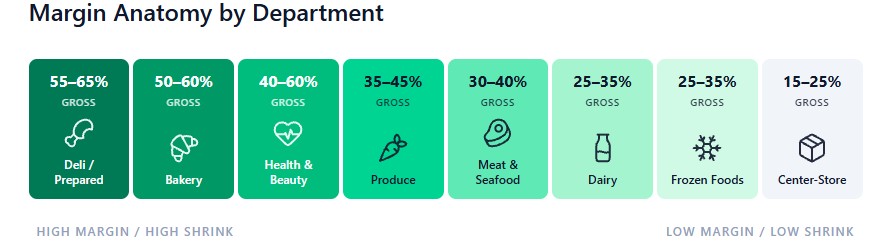
Gross Margins by Department
| Department | Typical Gross Margin | Labor as % of Sales | Shrink Rate | Strategic Role |
|---|---|---|---|---|
| Deli/Prepared Foods | 55%–65% | 40%–50% | 5%–8% | Highest gross margin, but labor-intensive; drives convenience and basket size |
| Bakery | 50%–60% | 25%–35% | 3%–5% | Premium impulse purchases, fresh perception, complements deli |
| Produce | 35%–45% | 8%–12% | 5%–10% | Solid margins but highest shrink category (31% of all surplus food waste); particularly vulnerable to tariff-driven cost shocks on imported items (Mexican tomatoes, avocados, berries at up to 25% tariff rates in 2026) |
| Meat/Seafood | 30%–40% | 15%–20% | 3%–5% | High-dollar basket builders, service model differentiates from discount |
| Dairy/Refrigerated | 25%–35% | 5%–8% | 2%–4% | Traffic driver (milk, eggs), moderate margins, essential category; 2025 avian flu outbreak caused temporary wholesale egg price spikes that broke loss-leader economics for several months |
| Center-Store Packaged Goods | 15%–25% | 2%–4% | 1%–2% | Low margin but low labor and shrink, stable inventory, national brand competition |
| Frozen Foods | 25%–35% | 3%–5% | 1%–2% | Moderate margins, low shrink, growing category (convenience trend) |
| Health/Beauty/Pharmacy | 40%–60% | 5%–10% | 2%–3% | Profit center that offsets food margins, prescription traffic driver |
| Private Label (all categories) |
25%–35% higher than national brands | Varies | Varies | Margin lever + customer loyalty, 24–26% of unit volume industry-wide |
Operational Context: Net margin is calculated after deducting labor, occupancy, utilities, shrink, and corporate overhead from gross margin. A 35% gross margin on produce becomes 2%–4% net after 10% shrink and 10% labor. Managing COGS effectively is critical to maintaining these margins.
Loss Leader Strategy: Economics of Below-Cost Pricing
Loss leaders represent one of the most misunderstood aspects of grocery pricing. The strategy involves selling specific products at or below wholesale cost to drive store traffic, with the expectation that customers will purchase higher-margin items during the same visit.
How Loss Leaders Work Without Destroying Profitability
The Basket Economics Model
| Scenario | Financial Impact |
|---|---|
| Rotisserie chicken sold at $4.99 (cost: $6.50, loss: $1.51) |
Average customer buys $45–$65 in additional items at 20–25% gross margin, generating $9–$16 in gross profit, netting $7.50–$14.50 after the chicken loss |
| Milk sold at break-even (no profit, no loss) |
Customer purchases bread, cereal, lunch meat, snacks at 15–35% margins, increasing basket size by 30–50% vs. milk-only trip |
| Eggs promoted at 20% below cost (loss: $0.80/carton) |
60% of egg buyers add bacon, cheese, or breakfast items at 40–60% margins, recovering 5–8x the egg loss; note: 2025 avian flu outbreak caused wholesale egg price spikes that temporarily made this strategy unsustainable for several months |
Key Principles
- Limited assortment impact: Only 50 to 200 SKUs out of 25,000–50,000 are true loss leaders (<1% of total assortment). The remaining 99% of items are priced at or above target margin.
- Strategic placement: Loss leaders (milk, eggs, bread) are positioned at the back of the store, requiring customers to pass through higher-margin categories (produce, deli, bakery, center-store) to reach them.
- Complementary adjacencies: Rotisserie chicken is placed next to $5 salad kits (60% margin), $8 wine (40% margin), and $4 desserts (50% margin)—all designed as high-margin add-ons.
- Purchase limits: “Limit 2 per customer” or “Limit 4 per household” prevents stockpiling and ensures the promotion drives multiple trips rather than one bulk purchase.
- Promotional funding: 40% to 60% of promotional costs are funded by manufacturers through trade promotion allowances, reducing the retailer’s actual out-of-pocket loss.
- Vulnerability to supply shocks: Loss leader economics depend on stable wholesale costs. The 2025 avian flu outbreak demonstrated how quickly this can break—egg prices spiked so sharply that retailers physically could not sustain promotional pricing below cost for several months.
Common Loss Leader Categories
| Product | Typical Pricing Strategy | Purpose |
|---|---|---|
| Milk (gallon) | At or below wholesale cost | Most price-sensitive item, shoppers know the “right” price, drives weekly trips |
| Eggs (dozen) | 10%–25% below cost during promotions | Breakfast category anchor, pairs with high-margin bacon, cheese, bread; 2025 avian flu temporarily broke this model |
| Bread (national brand) | At break-even or slight loss | Staple purchase, complements deli meat, cheese, peanut butter |
| Rotisserie Chicken | $4.99–$6.99 (often below cost) | Dinner solution, drives salad, wine, side dish, dessert purchases |
| Bananas | $0.49–$0.69/lb (at or below cost) | Highest-traffic produce item, leads to full produce basket |
| Ground Beef | Promotional pricing at or near cost | High-dollar item, pairs with pasta, cheese, vegetables, sauces |
Financial Impact: When executed correctly, loss leaders increase overall store profitability by 3% to 8% through larger basket sizes and higher-margin complementary purchases.
Supplier-Funded Promotions: Who Really Pays for Sales
A significant portion of promotional activity in grocery retail is not funded by the retailer—it’s paid for by manufacturers through various trade promotion mechanisms.
Trade Promotion Structure
| Promotion Type | Who Pays | Typical Funding Level | Purpose |
|---|---|---|---|
| Temporary Price Reductions (e.g., “20% off Kellogg’s cereal”) |
40%–70% manufacturer, 30%–60% retailer | Manufacturer provides off-invoice allowance or rebate | Drive volume, clear inventory, compete with private label |
| Buy One Get One Free (BOGO) | 50%–100% manufacturer | Manufacturer funds free unit cost | Trial new products, defend market share, respond to competitor promotions |
| Circular/Weekly Ad Features | 100% manufacturer (plus retailer labor) | $500–$5,000 per item per week depending on chain size | Premium placement, guaranteed traffic, brand visibility |
| Digital Coupons (app-loaded) | 60%–100% manufacturer | Manufacturer funds redemption value + platform fee | Targeted promotions, data capture, personalized offers |
| Endcap/Display Features | 100% manufacturer | $1,000–$10,000 per week per display | High-visibility placement, impulse purchases, new product launches |
| Slotting Fees (shelf space rental) |
100% manufacturer | $250–$1,000 per item per store; $5,000–$75,000 per SKU for regional/national rollout | Secure shelf space, offset retailer risk of carrying new products |
Net Effect on Retailer Margins
When a grocer runs a promotional flyer with 100 items on sale:
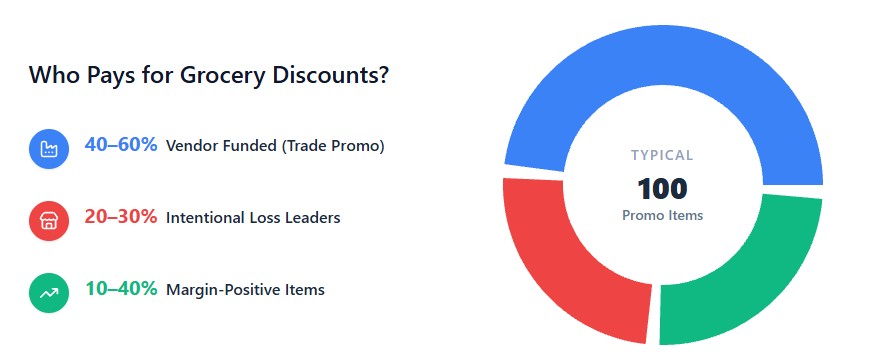
- 40% to 60% of discount costs are funded by manufacturers through trade promotions
- 20% to 30% are intentional loss leaders (below cost to drive traffic)
- 10% to 40% are margin-positive (sale price still above retailer’s net cost after manufacturer allowances)
This structure allows retailers to run aggressive promotions while protecting overall store profitability.
Self-Checkout Shrink: The Hidden Margin Destroyer
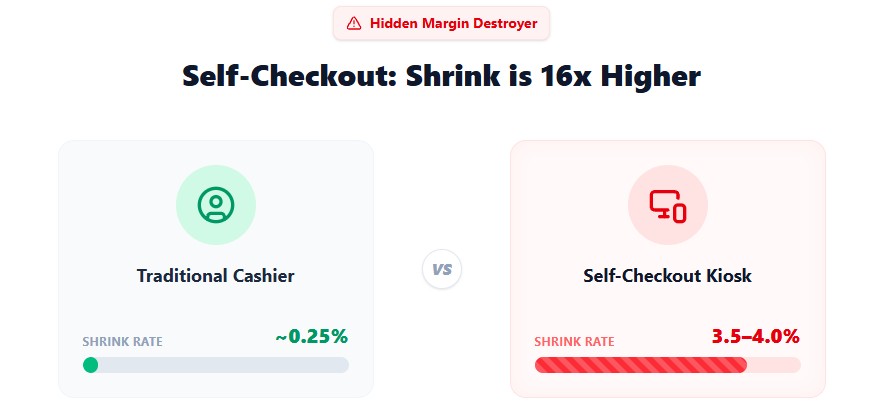
Self-checkout systems, now handling up to 60% of transactions at leading chains (approximately 40% industry-wide as of 2025–2026), have introduced a significant and often overlooked margin pressure point. Shrink rates at self-checkout lanes run 3.5–4%, approximately 16 times higher than at traditional cashier-operated registers. This includes both intentional theft (scan avoidance, produce misrepresentation) and unintentional errors. For a retailer operating on 1.5–2% net margins, the differential shrink from self-checkout represents a meaningful drag on profitability that offsets much of the labor savings from reduced staffing. Learn more about shrinkage in grocery stores.
Dynamic Pricing and Margin Protection Technology
Traditional grocery pricing was done quarterly by category managers working from spreadsheets. Modern retailers use AI-powered pricing engines that adjust prices in near real-time based on competitor activity, demand elasticity, inventory levels, and local market conditions. Monitoring your inventory turnover ratio can also help optimize pricing strategies.
“We see AI as a meaningful opportunity to both improve the customer experience and drive productivity across our business. We’re already seeing results from more competitive pricing.” — Ronald Sargent, Kroger Chairman, Q4 2025 earnings call
AI Pricing Optimization: Capabilities and Impact
| Technology | Function | Margin Impact | Adoption Rate (2025) |
|---|---|---|---|
| Competitive Price Monitoring | Scrapes competitor websites/apps, flags items where store is uncompetitive | Prevents lost sales from price perception, protects volume on key items | ~70% of large chains |
| Demand Elasticity Modeling | ML algorithms predict how volume changes with price for each SKU | +3–8% margin on optimized categories | ~50% of large chains |
| Markdown Optimization | Determines optimal timing and depth of clearance markdowns based on shelf life, demand, and inventory | +5–10% recovery on clearance items, -10–20% shrink | ~40% of large chains |
| Electronic Shelf Labels (ESLs) | Digital price tags updated remotely, enabling real-time price changes | Enables dynamic pricing without manual labor, reduces pricing errors | 40,000+ U.S. store locations |
| Personalized Promotions | App-based coupons tailored to individual shopper behavior | +2–5% basket size, higher redemption rates vs. blanket promotions | ~55% of large chains |
Real-World Results
Retailers deploying 6+ AI pricing and optimization use cases simultaneously report 3.5x ROI on technology investment, 200 to 400 basis points of margin protection vs. competitors without AI, 95%+ inventory accuracy from integrated demand forecasting, and 3–8% margin improvement on optimized categories.
Retail Media Networks: The Margin Game-Changer
Retail media networks (RMNs) represent the most significant profit innovation in grocery retail over the past five years. By selling advertising space on their websites, apps, and in-store digital screens, grocers generate high-margin revenue that offsets thin food margins.
“Kroger Precision Marketing remains one of KR’s clearest high-margin growth drivers. Profit from the business grew more than 20% in the first quarter of fiscal 2026, supported by stronger on-site traffic and increased advertiser commitments.” — Zacks Investment Research analysis of Kroger Q1 2026
Retail Media Economics
| Metric | Value | Context |
|---|---|---|
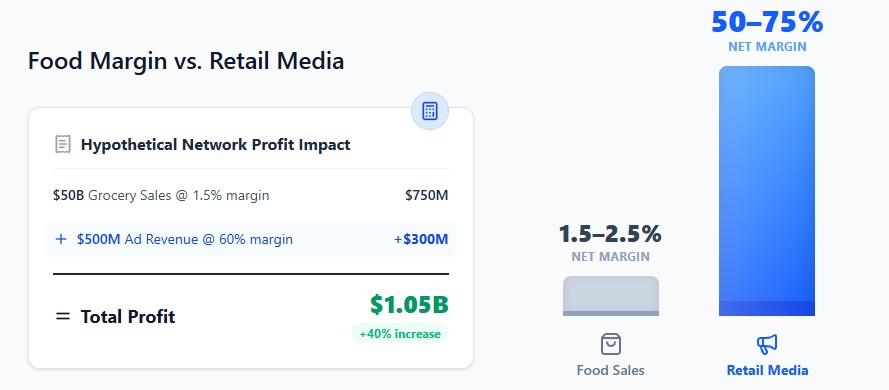
| Operating margin on ad sales | 50%–75% | vs. 1.5%–2.5% on food sales |
| Market size (2025) | $24 billion | U.S. retail media ad spending |
| Market forecast (2031) | $34.7 billion | 6.35% CAGR from 2026–2031 |
| Instacart Ads revenue | ~$1 billion annually | Basket-level targeting across multiple grocers |
| Walmart Connect revenue | $6.4 billion (2025) | Largest grocery RMN, fastest-growing ad business |
| Kroger Precision Marketing | Hundreds of millions annually | 800+ brand partners, 60 million households |
Profit Impact Example
For a chain doing $50 billion in revenue at 1.5% net margin:
- Food business profit: $750 million (1.5% of $50B)
- Add $500 million in RMN revenue at 60% operating margin: $300 million additional profit
- Total profit: $1.05 billion (40% increase without selling more food)
Industry Outlook and Forecasts (2026–2028)
Analysts project continued margin pressure for conventional supermarkets, with differentiation between winners and losers driven by technology adoption, private label penetration, retail media scale, and external shock absorption (tariffs, supply chain disruptions). Conducting a SWOT analysis can help identify these trends early.
Key Forecast Elements
| Factor | Impact on Margins | Timeline |
|---|---|---|
| Discount format expansion (Aldi, Lidl, Dollar General) |
-0.2% to -0.5% margin pressure on conventional chains | 2026–2028 |
| Private label growth (projected 28–30% of unit volume by 2028) |
+0.3% to +0.5% margin improvement for chains with strong own-brand programs | 2026–2028 |
| Retail media scaling (market to reach $34.7B by 2031) |
+0.5% to +1.0% net margin contribution for top-10 chains with mature RMNs | 2026–2028 |
| Tariff pass-through (2025 trade policies, 12–18 month lag) |
-0.3% to -0.8% margin pressure in 2026 as ~80% retailer absorption drops to ~20%; peak impact April–October 2026 on shelf prices; produce imports (Mexican tomatoes, avocados, berries at up to 25% tariffs) particularly affected | 2026–2027 (peak), moderating 2028 |
| Labor cost inflation (projected 4–6% annually) |
-0.3% to -0.7% margin pressure without productivity gains | 2026–2028 |
| Technology-driven productivity (AI pricing, labor optimization) |
+0.5% to +1.0% margin recovery for adopters | 2026–2028 |
| Consolidation (small independents unable to invest) |
Neutral for industry, +0.2% to +0.4% for surviving chains gaining share | 2026–2028 |
Consensus Forecast: Conventional supermarket net margins will remain in the 1.5% to 2.0% range through 2028, with discount and specialty formats continuing to outperform at 3% to 6%. Chains that successfully scale private label, retail media, and AI-driven operations will achieve the upper end of this range or exceed it. Trade tariff impacts (introduced April 2025) will peak during April–October 2026 before moderating as costs pass through to consumers. To navigate these challenges, ensure you have robust cash flow management and consider small business loans if needed. Also, don’t forget to review your tax strategy to maximize deductions. Finally, ensure you have all necessary licenses and permits to operate smoothly.