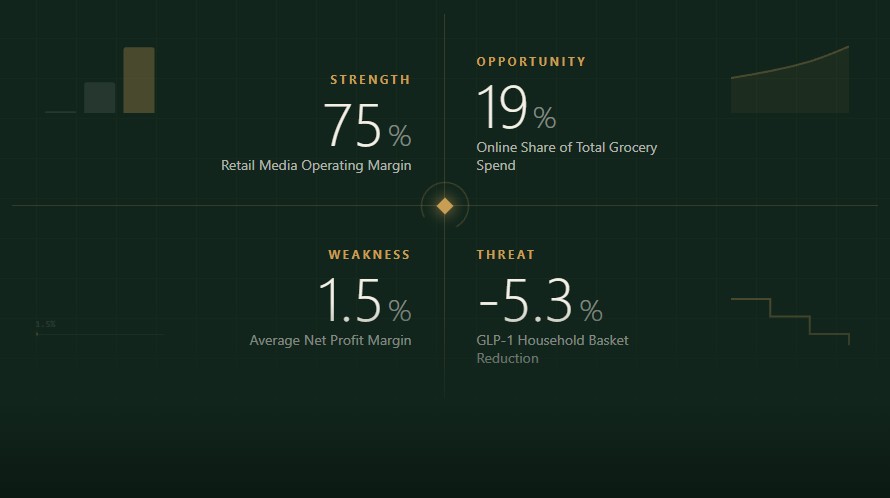
Grocery is a $963 billion U.S. industry that most operators still run on gut instinct. That’s the paradox: the sector is large, stable, and essential, yet net margins sit at 1.5%–2.5%, one merger attempt just collapsed in court, and AI answer engines are already rerouting shoppers before they ever see a shelf. A SWOT analysis only earns its place if it’s built on what’s actually happening in the market, not generic textbook boxes (“strong brand,” “high competition”). This breakdown uses 2025–2026 data — from Numerator’s retailer market-share tracking to a first-of-its-kind AI visibility study — to build a SWOT framework operators can actually act on, plus a TOWS matrix that turns the four quadrants into strategy.
Why This Matters Now
The industry looks stable on the surface: revenue is growing at a 1.5% five-year CAGR and reached $963.3 billion in 2026, according to IBISWorld. But that topline number hides a structural fight for share. The Kroger–Albertsons merger — the largest proposed consolidation in U.S. supermarket history — collapsed in December 2024 after federal and state courts blocked it, and Albertsons is suing Kroger for damages over the failed deal, according to CNN. At the same time, online grocery crossed 19% of total grocery spend in December 2025, up 4.3 points year over year, and 130,000+ union grocery workers had contracts up for renegotiation in 2025 alone. None of this fits neatly into “internal vs. external” — it’s the operating environment every grocery SWOT now has to account for.
Industry Snapshot (2025–2026)
| Metric | Value | Source |
|---|---|---|
| U.S. supermarket industry revenue (2026) | $963.3B (1.6% growth YoY, 1.5% 5-yr CAGR) | IBISWorld |
| Average net margin, conventional supermarkets | 1.5%–2.5% | Industry benchmarks. See our guide on grocery store profit margins. |
| Online grocery share of total grocery spend | 19% (Dec. 2025), up from 14.7% a year earlier | Brick Meets Click/Mercatus |
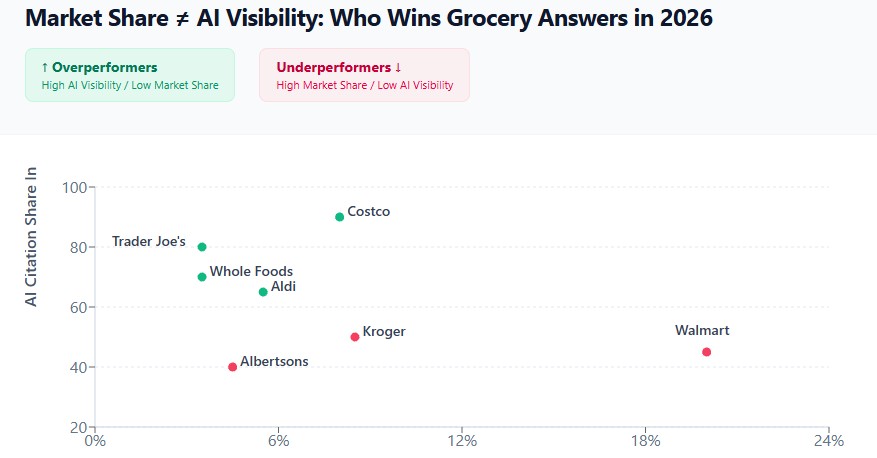
| Walmart U.S. grocery market share | 19.9%–21% (declining from 20.4% in 2024) | Numerator |
| Kroger–Albertsons merger status | Blocked Dec. 2024; terminated; Albertsons suing for damages | Court filings, CNN |
| U.S. households with a GLP-1 user | ~16% | Cornell University / Journal of Marketing Research |
| Grocery union workers with contracts up in 2025 | 130,000+ across 5 states | UFCW, Jacobin |
Taken together, these numbers describe an industry that’s growing in aggregate but consolidating in neither direction — no single retailer is running away with it, and the traditional lever for building scale, M&A, is now legally riskier than it’s been in decades. That’s precisely the environment where a retailer’s own strengths and weaknesses matter more than the industry tailwind. One longtime retail analyst captured the mood at the time:
“I’m in a state of professional and commercial shock that they would take this scorched-earth approach.”
Strengths: What Grocery Retailers Have Working For Them
Grocery’s core strength hasn’t changed in decades — people have to eat — but how that strength is monetized has shifted hard toward data, private label, and ancillary revenue rather than the food itself. Implementing a robust private label strategy is a key strength for many modern retailers.
| Strength | Evidence | Who Exemplifies It | Why It Matters |
|---|---|---|---|
| Recession-resistant, non-discretionary demand | Grocery sales kept growing (+1.6% in 2026) even as food-at-home prices rose sharply over the past five years | All formats | Provides a demand floor competitors in discretionary retail don’t have |
| Private label as a built-in margin lever | Store brands run 30–40% gross margin vs. ~26% for national brands; PL sales hit $282.8B in 2025 | Kroger, Aldi, Trader Joe’s, Costco (Kirkland) | Margin expansion without needing more customers |
| Retail media as a near-free profit center | Ad sales carry 50%–75% operating margin vs. 1.5%–2.5% on food; Walmart Connect alone generated $6.4B in 2025 | Walmart, Kroger, Amazon/Whole Foods | Turns existing foot traffic and first-party purchase data into high-margin revenue without selling more groceries. Learn more about grocery store unit economics & profit centers. |
| Membership and scale economics | Costco’s operating income is roughly half-funded by membership fees, letting it hold food margins near cost | Costco, Sam’s Club | Buffers against price wars that would sink a pure-margin retailer |
| Trust and blind-test parity for store brands | 72% of shoppers can’t tell private label from national brands in blind taste tests; 84% trust PL quality as much or more | Aldi, Trader Joe’s, Kroger’s Simple Truth | Removes the historical “cheap alternative” ceiling on private label growth |
| Format specialization / curated assortment | Trader Joe’s runs ~4,000 SKUs and $15–$20M revenue per store vs. $8–$12M for conventional stores | Trader Joe’s, Aldi | Smaller assortments cut labor and shrink while raising sales density |
The common thread across all six strengths is that none of them come from selling more groceries. Private label, retail media, membership fees, and curated assortment are all ways to extract more value from the same basket — which points directly at where the next quadrant, weaknesses, actually originates: the food itself still barely makes money on its own.
Weaknesses: What Still Drags on the Sector
Grocery’s weaknesses are less about any one company failing and more about structural features of the business that no operator has fully solved — thin margins, labor exposure, and a growing blind spot in how customers now discover where to shop.
| Weakness | Evidence | Impact |
|---|---|---|
| Razor-thin net margins | 1.5%–2.5% industry average, some regions (Northeast, California) as low as 1.2%–1.3% | A single pricing error, labor cost spike, or supply hiccup can erase profitability for a quarter |
| Heavy union leverage and labor cost exposure | 130,000+ UFCW-represented workers had contracts expiring in 2025 across Kroger and Albertsons banners; Colorado King Soopers workers struck for two weeks in February 2025 | Wage settlements ($2.50–$5.00/hour asks) land directly on a cost base that’s already the largest controllable expense |
| Persistent shrink, even as headline theft eases | Shoplifting incidents fell 12.4% in 2025 — the first annual drop since 2021 — but reported rates still sit 37% above 2021 levels, and no organization has published a national shrink dollar figure since NRF’s $112.1B 2022 estimate (the survey behind it was discontinued) | Retailers are now flying partly blind on the true scale of a cost that historically ran ~1.4–1.6% of sales. Read more about shrinkage in grocery stores. |
| Self-checkout shrink offsetting labor savings | Shrink at self-checkout lanes runs 3.5%–4%, roughly 16x higher than cashier-staffed lanes | Erodes the labor-cost rationale for self-checkout expansion |
| AI answer-engine invisibility despite market dominance | Walmart holds ~21% of U.S. grocery spend but ranks fourth in AI citation share; Costco ranks first, followed by Trader Joe’s and Whole Foods, per 5W’s May 2026 AI Visibility Index | As shopping queries shift from search engines to AI assistants, market share built on stores and price no longer guarantees being recommended |
| Fragmented, high-SKU-count cost structure | Conventional stores run 25,000–50,000 SKUs vs. 1,400–1,600 at Aldi | Higher labor for stocking, higher shrink exposure, harder to negotiate volume pricing per SKU |
| Exposure to a failed-consolidation aftermath | Kroger and Albertsons are now litigating against each other instead of combining scale to compete with Walmart and Amazon | Two of the industry’s largest conventional players are distracted and weakened relative to Walmart, Costco, and Amazon during a critical competitive window |
Two of these weaknesses are more forgiving than they look, and two are not. Union labor cost and shrink are cyclical — they compress and ease with the broader economy and with technology investment. The National Retail Federation’s own read on 2025 theft data reflects that:
“Retailers are beginning to see levels stabilize, driven by investments in technology and employee training.”
AI invisibility is a different kind of weakness — it isn’t cyclical, and it’s compounding the longer it goes unaddressed. As 5W’s Ronn Torossian put it after ranking the top 25 U.S. grocers by AI citation share:
“Market share is a lagging indicator. AI citation share is a leading indicator.”
That distinction is why AI visibility shows up twice in this analysis — once as a weakness, once as an opportunity — and why it lands at the top of the priority matrix later in this piece.
Regional SWOT Variations: Why Location Changes the Analysis
A national SWOT hides how differently these factors play out by geography. The same “thin margin” weakness looks structurally different in Texas than it does in California, because labor cost, union density, and tariff exposure aren’t evenly distributed.
California and the Northeast carry the weakness furthest. Net margins run 1.2%–2.0% in these regions — the lowest in the country — driven by the highest minimum wages in the U.S. ($16–$20/hour in California), the strongest union density among grocery workers, and the highest occupancy costs. These same regions are also the most exposed to the produce-tariff threat: West Coast and Northeast chains lean more heavily on imported Mexican produce (tomatoes, avocados, berries facing tariffs up to 25%), stacking a cost-side threat on top of an already-thin margin structure.
The Southeast and South Central states convert the same national weaknesses into a relative strength. Margins run 2.0%–3.0% in the Southeast and 2.0%–2.8% in South Central states, supported by lower labor and occupancy costs, no state income tax in several markets (a de facto labor-cost advantage), and population growth that’s expanding the customer base rather than fragmenting it further. It’s not a coincidence that Aldi’s most aggressive 2026 store growth and its Southeastern Grocers acquisition are concentrated in exactly these lower-cost, higher-growth regions.
| Region | Net Margin Range | Dominant SWOT Factor |
|---|---|---|
| California | 1.3%–2.0% | Weakness/Threat: highest labor cost + tariff exposure on imported produce |
| Northeast (NY, NJ, MA, CT, PA) | 1.2%–2.0% | Weakness/Threat: highest occupancy cost + strongest union density |
| Pacific Northwest | 1.5%–2.2% | Weakness: $15–$17/hour minimum wage, strong union presence |
| Southeast (FL, GA, TN, NC, SC) | 2.0%–3.0% | Strength/Opportunity: lower costs + population growth = discount-format expansion target |
| South Central (TX, OK, AR, LA) | 2.0%–2.8% | Strength: no state income tax, Walmart/Albertsons keep pricing competitive rather than eroding it |
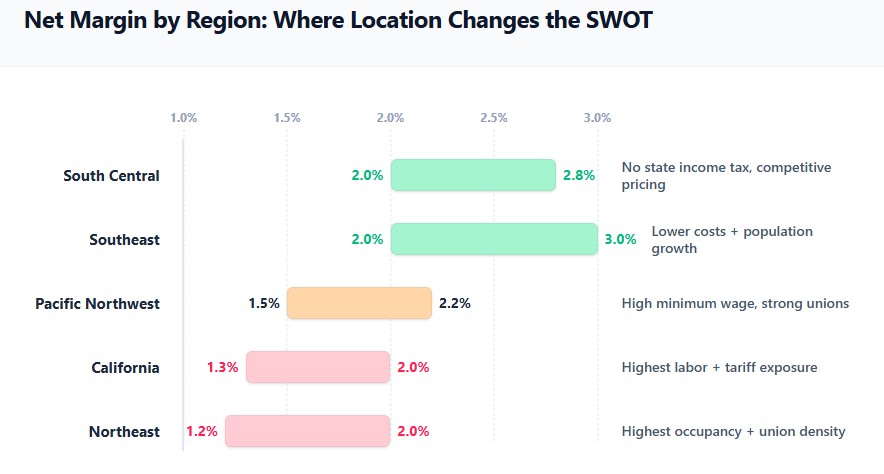
The practical implication: a regional or independent grocer in the Southeast should weight the SWOT toward opportunity capture (growth, discount-format competition), while the same-size operator in California or the Northeast needs to weight it toward threat mitigation (labor cost control, tariff-resilient sourcing) — the four quadrants are the same, but the strategic emphasis inside them isn’t.
Opportunities: Where the Next Margin Points Come From
| Opportunity | Evidence | Action Window |
|---|---|---|
| Private label penetration still has room to run | Currently 24–26% of unit volume industry-wide; projected to reach 28–30% by 2028 | 2026–2028 |
| Retail media networks are still early | $24B U.S. retail media ad spend in 2025, forecast to hit $34.7B by 2031 (6.35% CAGR); most mid-size and independent grocers haven’t launched a network yet | 2026–2028 |
| Online grocery is compounding, not plateauing | Online sales hit a record $12.7B in December 2025 alone, up 32% year over year, pushing e-commerce to 19% of total grocery spend | Now through 2028 |
| A consolidation vacuum exists among conventional grocers | Two of the top-5 conventional grocers are now suing each other instead of merging, and neither can pursue major M&A while litigation is active | 2025–2027 |
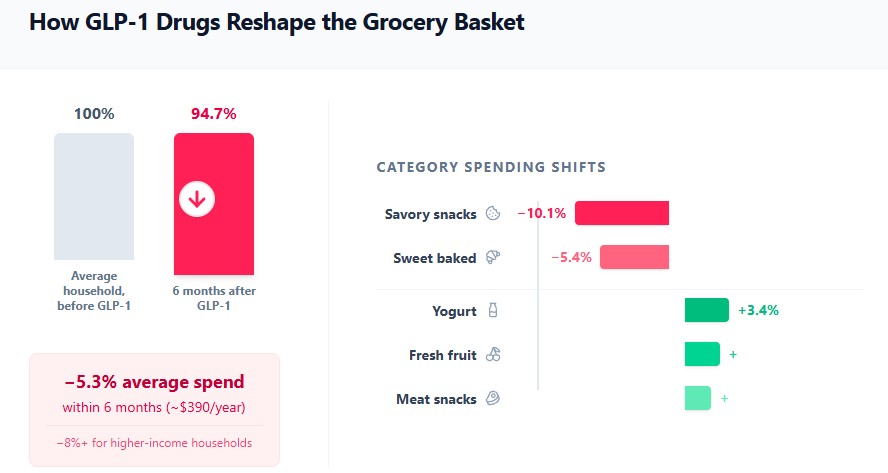
| GLP-1 adoption is reshaping category winners, not just shrinking baskets | GLP-1 households cut savory snacks 10.1% and sweet baked goods 5.4%, but increased spending on yogurt (+3.4%), fresh fruit, nutrition bars, and meat snacks; 16% of U.S. households already have a GLP-1 user | 2026–2028, accelerating |
| AI search optimization is a nearly greenfield channel | Only a handful of retailers (Costco, Trader Joe’s, H-E-B, Wegmans) are currently winning AI citation share disproportionate to their store footprint | 2026 (early-mover window) |
| Tariff-driven supply chain diversification builds resilience AND margin | Costco’s 2025 shift of Kirkland laundry sourcing to regional Asian manufacturing cut member prices up to 40% in Asia-Pacific markets while hedging tariff exposure | 2026–2027 |
Notice that four of these seven opportunities exist specifically because something else in the industry broke or stalled — the merger collapse, the AI-visibility gap, and GLP-1-driven category disruption are all openings created by someone else’s problem, not organic growth. That’s a useful filter for prioritization: opportunities born from a competitor’s stumble tend to have a shorter shelf life than ones built on structural demand shifts like private label and online grocery, so they belong at the top of a 2026 action list, not the bottom.
Threats: What Could Erode the Model
| Threat | Evidence | Exposure |
|---|---|---|
| GLP-1 drugs are shrinking the overall grocery basket | Households with a GLP-1 user cut total grocery spending by 5.3% within six months (over 8% among higher-income households), averaging $390 less per year on food; effect persists at least a year among continuing users | Center-store packaged goods, snacks, and bakery categories most exposed |
| Walmart, Costco, and Amazon keep taking share from conventional grocers | Kroger’s market share fell from 8.8% (2024) to 8.3% (2026); Albertsons fell from 4.8% to 4.5%; Costco rose from 7.6% to 8.2% over the same window | Conventional supermarkets are the structural share donor in this market |
| Labor cost inflation compounds with union bargaining power | Kroger’s initial 2025 contract offers of $0.25/hour raises triggered strikes; UFCW represents 1.3 million workers with coordinated, multi-state bargaining leverage | Labor already runs 40–50% of sales in service departments (deli, bakery) |
| Tariff pass-through on imported produce | Tariffs up to 25% on Mexican tomatoes, avocados, and berries, with peak shelf-price impact expected April–October 2026 | Produce departments, especially in Northeast/West Coast chains reliant on imports |
| Antitrust precedent makes future consolidation harder | The FTC and state courts blocked the Kroger-Albertsons deal specifically on the grounds it would reduce grocery competition and raise prices | Scale-building through M&A is now a materially riskier strategy for the next wave of conventional grocers |
| Discount and specialty formats keep out-executing on format economics | Aldi (77–80% PL share, 1,400–1,600 SKUs) and Trader Joe’s (69–80% PL share, ~4,000 SKUs) post higher revenue per store and operating margin than conventional chains | Structural, not cyclical — conventional grocers can’t copy the format without rebuilding their real estate and supply chain |
| AI-mediated shopping bypasses traditional differentiation | As of 2026, AI assistants field grocery-related queries across price, quality, and delivery comparisons; the top 10 retailers capture 64% of AI citation share, and it’s not weighted toward market share leaders | Retailers optimized for in-store or search-engine visibility may lose relevance in a channel they haven’t measured yet |
The GLP-1 threat deserves particular attention because it’s the newest entrant on this list and the easiest to underestimate — it doesn’t show up in a competitor’s earnings call, it shows up quietly inside basket data. The Cornell researcher who led the underlying study described the pattern this way:
“The data show clear changes in food spending following adoption.”
Unlike a price war or a union contract, this threat doesn’t respond to a discount or a negotiation — it requires rethinking which categories a retailer leads with in its marketing and shelf space.
Company Snapshot: SWOT in One Line Per Retailer
| Retailer | Defining Strength | Defining Weakness | Biggest Opportunity | Biggest Threat |
|---|---|---|---|---|
| Walmart | 19.9–21% grocery market share, largest scale in the U.S. | Share is declining year over year despite size (20.4% → 19.9%) | Grocery is 59% of U.S. net sales and still growing 3.4% YoY — deepen category dominance | Losing share to Costco even while leading the market |
| Kroger | Category-by-category private label precision (Our Brands: 22–23% of sales) | Lacks the scale to close the gap on Walmart without a merger | Retail media (Kroger Precision Marketing profit +20% in Q1 FY2026) | Union contract renewals and ongoing litigation with Albertsons |
| Costco | Membership fees fund ~50% of operating income, enabling near-cost food pricing | Limited assortment (~4,000 SKUs) caps how much share it can take from full-service shoppers | Tariff-hedging through regional Kirkland sourcing, now a proven playbook | Membership growth ceiling in mature U.S. markets |
| Albertsons | Regional density (Safeway, Vons, Harris Teeter, Fred Meyer banners) | Weakest position of the major players since 2024; market share falling (4.8% → 4.5%) | Standalone technology and store investment now that merger capital is freed up | Litigation costs and distraction from the Kroger lawsuit |
| Aldi / Trader Joe’s | 69–80% private label share, format economics competitors can’t replicate | Limited full-basket appeal for shoppers who want 30,000+ SKU selection | Gen Z’s rising preference for private-label-forward formats | Format ceiling — can’t scale share further without diluting the model |
No two of these five retailers are fighting the same battle. Walmart’s fight is defensive (protect a declining share), Kroger’s is structural (rebuild scale without a merger), Costco’s is a ceiling problem, Albertsons is in recovery mode, and Aldi/Trader Joe’s are managing success rather than crisis. That’s the argument for running a SWOT by format as well as by company — the strategic problem is often shared across an entire tier of retailers, not unique to one name.
SWOT by Store Format
Company-specific SWOT is useful, but most operators are actually competing within a format, not against one named chain. Here’s the SWOT compressed to one bullet per quadrant for each major format.
SWOT for Conventional Supermarkets (Kroger, Albertsons)
- Strength: The deepest private label programs in the industry — Kroger’s Our Brands span four tiers and account for 22–23% of sales ($30B+, 13,000+ SKUs).
- Weakness: The highest union-labor exposure of any format — Kroger and Albertsons together account for the bulk of the 130,000+ UFCW contracts renegotiated in 2025.
- Opportunity: A rare competitive vacuum — with the merger dead and both companies in litigation, neither can out-invest Walmart or Costco in 2026, opening share for regional independents to pick up.
- Threat: The steepest market-share erosion among the top 5 — Kroger fell from 8.8% (2024) to 8.3% (2026); Albertsons fell from 4.8% to 4.5%.
SWOT for Discount Grocers (Aldi, Lidl)
- Strength: Format economics conventional grocers can’t copy — Aldi runs 77–80% private label share on just 1,400–1,600 SKUs per store.
- Weakness: Limited full-basket appeal — shoppers who want 30,000+ SKUs or specific national brands still have to shop elsewhere for part of their list.
- Opportunity: Aggressive white space — Aldi is opening 180 U.S. stores in 2026 alone, targeting 3,200 stores by 2028, partly through its acquisition of Southeastern Grocers.
- Threat: The format doesn’t guarantee success on execution alone — Lidl has opened fewer than 200 U.S. stores total since entering in 2017 and remains a marginal player at national scale, showing discount economics still require the operational discipline Aldi has and Lidl’s U.S. arm has struggled to match.
SWOT for Membership Clubs (Costco, Sam’s Club)
- Strength: Membership fees fund roughly half of Costco’s operating income, letting it hold Kirkland Signature pricing near cost (a ~15% markup cap) while still growing profit.
- Weakness: An assortment ceiling — around 4,000 SKUs per store means clubs can’t capture the shopper doing a full weekly basket the way a conventional grocer can.
- Opportunity: Tariff-hedging as a differentiator — Costco’s 2025 shift of Kirkland sourcing to regional Asian manufacturing cut member prices by up to 40% in Asia-Pacific markets, a playbook other clubs can adapt domestically.
- Threat: Growth increasingly means taking share from other clubs, not from grocers — Costco is one of only two top-5 U.S. grocery retailers still gaining share, which caps how much further membership penetration can climb.
SWOT for Online-First Grocers (Amazon Fresh/Whole Foods, Instacart)
- Strength: Same-day perishable delivery is scaling fast — Amazon’s perishable grocery sales through same-day delivery grew 40x between January 2025 and early 2026.
- Weakness: Physical-format experiments have repeatedly underperformed — Amazon closed all of its Amazon Fresh and Amazon Go physical stores in January 2026, redirecting that investment entirely into Whole Foods and online delivery.
- Opportunity: Whole Foods as the physical anchor for a digital-first strategy — Amazon plans 100+ new Whole Foods locations after the chain posted more than 40% sales growth since its 2017 acquisition.
- Threat: Delivery-intermediary share is consolidating around the retailers’ own infrastructure — third-party platforms like Instacart face gradual share erosion as Amazon and Walmart build out first-party delivery instead of relying on marketplace partners.
Four formats, four different primary vulnerabilities: conventional grocers are exposed on labor, discounters are exposed on execution discipline, clubs are exposed on a growth ceiling, and online-first players are exposed on the unit economics of physical experiments. A format-level SWOT like this is what a regional operator should actually benchmark against — not a single national average that blends all four together.
TOWS Matrix: Turning the Four Quadrants Into Strategy
A SWOT list is diagnostic. A TOWS matrix is the decision layer — pairing internal factors against external ones to generate a specific move, not just an observation.
| Opportunities | Threats | |
|---|---|---|
| Strengths | SO — Use strengths to capture opportunities: Use private label margin structure (30–40%) to fund AI-search optimization and content, since no competitor has claimed that channel yet. Use retail media’s high margin to subsidize price investment in GLP-1-aligned categories (fresh, yogurt, protein) before competitors reposition. | ST — Use strengths to blunt threats: Use membership/scale economics (Costco-style) to absorb tariff pass-through without raising shelf prices as fast as smaller rivals. Use private label trust (84% quality parity) to defend against discount-format share loss instead of matching Aldi/Lidl on price alone. |
| Weaknesses | WO — Fix weaknesses using opportunities: Use the current consolidation vacuum as a hiring and store-acquisition window to address labor and scale weaknesses cheaply while two major competitors are distracted. Use the AI-visibility gap as forcing function to finally invest in structured product data and content — a weakness (invisibility) turned into differentiation once fixed. | WT — Defensive moves: Renegotiate union contracts proactively with multi-year wage schedules before the next bargaining cycle, rather than reactively during a strike threat. Reduce self-checkout footprint or add spot-check staffing in high-shrink categories rather than absorbing the 16x shrink differential indefinitely. |
The SO and WO cells converge on the same two moves — AI-search investment and capitalizing on the merger vacuum — regardless of whether you approach them from a strength or a weakness. That convergence is usually a signal a move belongs at the top of a priority list, which is exactly where it lands next.
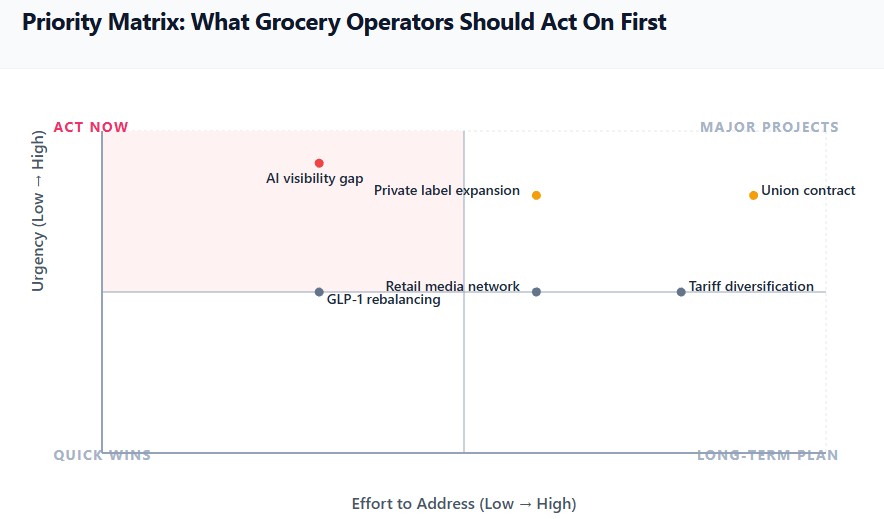
Priority Matrix: What to Act On First
| Factor | Urgency | Effort to Address | Recommended Sequence |
|---|---|---|---|
| AI answer-engine invisibility | High (early-mover advantage window) | Low–Medium (structured data, content, schema) | Now — cheapest fix with longest-lasting payoff |
| Private label expansion | High | Medium (sourcing, packaging, regulatory — see private label playbook) | Next 6–9 months |
| Union contract exposure | High | High (requires capital commitment) | Address before next bargaining cycle, not during |
| Retail media network launch | Medium | Medium (needs traffic and ad-tech partner) | 2026–2027 |
| GLP-1 category rebalancing | Medium | Low (merchandising and assortment shift) | Ongoing, quarterly review |
| Tariff-driven sourcing diversification | Medium | High (new supplier relationships) | 2026–2027, ahead of peak tariff impact window |
Notice that the highest-urgency item also has the lowest effort to address — that’s not a coincidence, it’s a sign most operators haven’t gotten to it yet. Everything else on this list requires either capital (union contracts, sourcing) or a multi-month cycle (private label, retail media), which is exactly why AI visibility belongs first: it’s the rare item on a grocery SWOT that can be improved this quarter rather than next year.
2026–2028 Outlook
| Trend | Direction | What It Means for the SWOT |
|---|---|---|
| Online grocery share | Rising (19% → projected 20%+ by 2028) | Strength for retailers with fulfillment infrastructure; threat for those without it |
| Private label penetration | Rising (24–26% → 28–30%) | Strengthens margin structure industry-wide, but rewards early movers disproportionately |
| AI-mediated shopping queries | Rising, still unmeasured by most operators | Emerging threat for market leaders, emerging opportunity for smaller/differentiated brands |
| GLP-1 household adoption | Rising (16% and climbing) | Structural threat to packaged/snack categories, structural opportunity for fresh/protein |
| Union bargaining activity | Elevated through 2026–2027 | Sustained weakness/cost pressure for unionized conventional chains |
| M&A and consolidation | Constrained by antitrust precedent | Removes a scale-building lever conventional grocers previously relied on |
Bottom Line
Grocery’s core strength — people have to eat — hasn’t weakened, but nearly every other advantage in this SWOT is now contested or time-limited. Private label margin, retail media, and membership economics are working, but they’re increasingly table stakes rather than differentiators. The real signal in the 2026 data is that two entirely new fault lines have opened where none existed three years ago: GLP-1 adoption is quietly reshaping which categories can be marketed on abundance versus moderation, and AI answer engines are starting to decide which retailers get recommended before a shopper ever opens a search engine — and right now, that ranking doesn’t track market share at all. Retailers who treat this SWOT as a one-time slide will miss both. The ones who rerun it quarterly, and pair it with a TOWS matrix instead of a static list, are the ones positioned to convert the current consolidation vacuum and the AI-visibility gap into real share gains before either window closes. To succeed, you must also master cash flow management, understand COGS, and optimize your inventory turnover ratio. Don’t forget to review your tax strategy and ensure you have all necessary licenses and permits. Finally, consider whether to buy or lease commercial real estate and explore small business loans if needed.