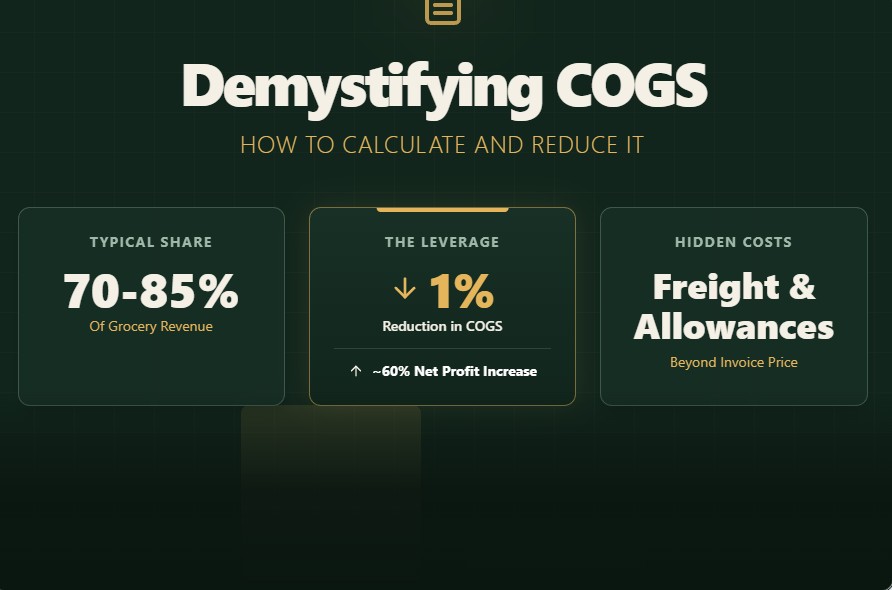
Cost of goods sold is the single largest line on a grocery store’s income statement — typically 70% to 85% of revenue, depending on format and category mix. That’s the mirror image of the gross margin numbers most operators already track (23%–28% for conventional supermarkets, down to 11%–15% for warehouse clubs), but COGS gets far less operational attention than it deserves. Most independent grocers calculate it once a year for taxes and never touch it again — even though a 1-percentage-point reduction in COGS on a $10M store is $100,000 straight to the bottom line, equal to nearly 60% of the entire annual profit for a store running at FMI’s 2024–2025 industry-average 1.7% net margin ($170,000 on $10M in sales). [FMI, 2025] Understanding this metric is critical for accurate grocery store unit economics.
This guide breaks down exactly what counts as COGS in a grocery business (it’s not just “what you paid the supplier”), how it differs by category, how promotions and vendor rebates quietly change your real number, where state-level rules add hidden cost, and which levers actually move it.
What Actually Counts as COGS for a Grocery Store
Grocery COGS is more complex than retail COGS in most other verticals because product moves through refrigeration, has a shelf life, and is priced against constant promotional noise. Per GAAP and standard grocery accounting practice (Kroger’s 10-K filings use this exact structure under “Merchandise costs, including advertising, warehousing and transportation”), COGS is built from five components, not one:
| Component | Included? | Notes |
|---|---|---|
| Invoice cost of product | Yes | Net of trade discounts and early-payment terms |
| Inbound freight | Yes | Cost to move product from supplier/DC to store |
| Warehousing costs | Yes (if self-distributed) | DC labor, receiving, inspection — excluded if you buy fully delivered from a wholesaler |
| Vendor allowances & rebates | Subtracted | Off-invoice allowances, volume rebates, co-op patronage — all reduce COGS, not treated as separate income |
| Normal spoilage/shrink on perishables | Yes, in most grocery accounting | Treated as a cost of the product itself, distinct from theft-related shrink, which usually sits in a separate shrink/loss line |
Source: Kroger 10-K accounting policy disclosures, standard grocery GAAP treatment
The mistake most new operators make: treating “wholesale invoice price” as COGS and stopping there. That ignores freight (2%–5% of landed cost for most categories), vendor allowances (can offset 3%–10% of gross invoice cost — see the promotions section below), and normal spoilage baked into perishable categories. A store that only tracks invoice price is routinely off by 3–8 percentage points on its real COGS ratio.
The COGS Formula (and Which Inventory Method You’re Actually Using)
The standard formula:
COGS = Beginning Inventory + Purchases (net of returns/allowances) + Freight-In − Ending Inventory
The complication for grocery is how you value beginning and ending inventory, because the method changes the number materially in an inflationary environment — which is exactly the environment grocery has been in since 2022.
Inventory Valuation Methods in Grocery
| Method | How It Works | Who Uses It | Effect on COGS During Inflation |
|---|---|---|---|
| Retail Inventory Method (RIM) | Values inventory at retail price, backs into cost using a cost-to-retail ratio by department | Most conventional supermarkets (Kroger, Albertsons) | Standard, department-level accuracy without item-level cost tracking |
| LIFO (Last-In, First-Out) | Assumes the newest, most expensive inventory sells first | ~90%+ of large grocery chains for tax purposes (Kroger reported ~95% of inventory on LIFO historically) | Higher COGS, lower taxable income during inflation — the “LIFO reserve” grows every year prices rise |
| FIFO (First-In, First-Out) | Assumes oldest inventory sells first | Most independents, smaller chains, perishables specifically (mandatory in practice — you can’t sell 2-week-old milk after new milk) | Lower COGS, higher taxable income during inflation vs. LIFO |
| Weighted Average Cost | Blends all inventory costs into a single average per SKU | Smaller independents using basic POS/inventory software | Smooths out price swings, easiest to administer with simple software |
Why this matters for a small operator: large chains run LIFO specifically because it lowers taxable income when supplier costs are rising — Kroger’s LIFO reserve (the cumulative gap between LIFO and FIFO valuation) has grown by hundreds of millions of dollars through the 2022–2025 inflation cycle. If you’re a $5M–$20M independent still on a simple weighted-average or FIFO system, you’re likely overstating taxable income relative to what a LIFO election would produce in an inflationary year. This is a conversation to have with a CPA who has grocery clients specifically — the LIFO conformity rule (you must use LIFO for book purposes if you use it for tax) has real implications for how your financials look to a lender. For more details, see our guide on grocery store tax strategy.
Worked Example: Calculating COGS for One Month
Here’s the formula with real numbers plugged in, for a mid-size independent grocer closing out a single month:
COGS = Beginning Inventory + Purchases (net of allowances) + Freight-In − Ending Inventory
| Line Item | Amount |
|---|---|
| Beginning Inventory (Oct. 1, at cost) | $420,000 |
| + Purchases during October (net of vendor allowances/rebates) | $610,000 |
| + Freight-In (inbound freight from DC/suppliers to store) | $18,500 |
| − Ending Inventory (Oct. 31, at cost, from physical or perpetual count) | $395,000 |
| = COGS for October | $653,500 |
If October revenue was $880,000, this store’s COGS ratio for the month is:
$653,500 ÷ $880,000 = 74.3%, which translates to a 25.7% gross margin — squarely in the conventional-supermarket benchmark range.
A few things worth double-checking when you run this yourself: (1) “Purchases” should already be net of any off-invoice allowances and rebates recorded in the period, not gross invoice cost — see the promotions section below for why that gap matters; (2) freight-in only includes inbound cost to get product into your store or DC, never outbound delivery cost to customers, which sits in operating expenses; (3) if your ending inventory figure comes from a perpetual (POS-driven) count rather than a physical count, see the Phantom Inventory section below before you trust it at face value.
Grocery Store COGS Calculator: Plug In Your Own Numbers
Adjust for unrecorded shrink (phantom inventory)
If your ending inventory comes from a perpetual (POS) count rather than a physical count, unrecorded shrink is still sitting on your books as phantom inventory. Enter it here to see adjusted COGS.
How to Track COGS by Department (Not Just Store-Wide)
A single monthly COGS number tells you almost nothing about where the cost pressure actually is. A practical tracking cadence:
| Element | Recommendation |
|---|---|
| Data source | POS/inventory system sales and cost data, reconciled against distributor invoices and vendor allowance statements |
| Level of detail | By department at minimum (produce, dairy, meat, center-store, etc.); by category within department if your system supports it |
| Frequency | Weekly flash COGS ratio by department; full reconciliation (including allowances and freight true-up) monthly |
| Trigger for a physical count | Any department showing more than a 2–3 point swing in COGS ratio week-over-week without a known pricing or promotional cause |
| Dashboard | A single department-level view showing COGS ratio, shrink %, and gross margin side by side — not three separate reports nobody cross-references |
| Owner | Department head or category manager for the weekly number; controller or owner for the monthly reconciliation and any variance investigation |
The habit that actually matters here isn’t the software — it’s someone with department-level accountability looking at the number every week, not just at month-end close.
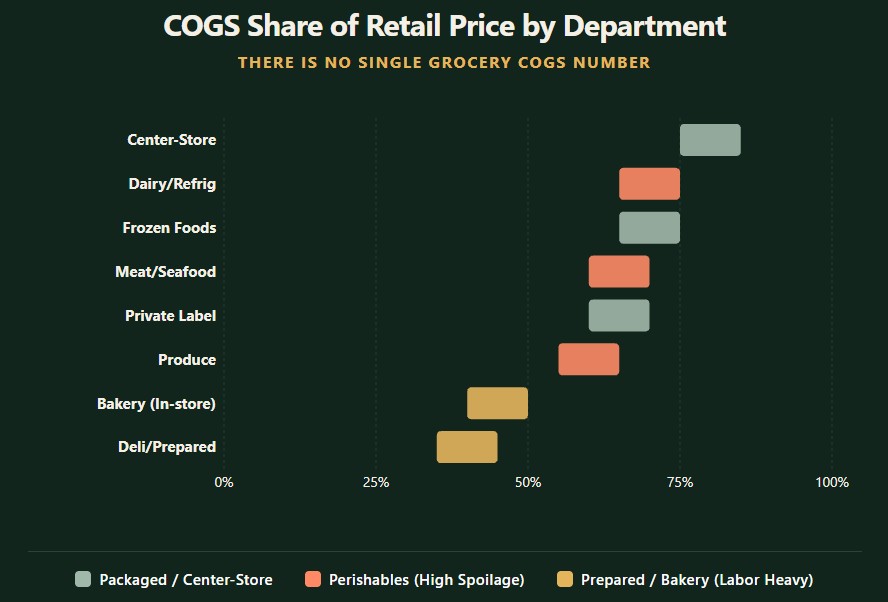
COGS by Category: There Is No Single Grocery COGS Number
A store-wide COGS percentage hides more than it reveals. Each department carries a fundamentally different cost structure, and the biggest operational mistake is managing to a single blended target instead of a department-level one.
COGS Share of Retail Price by Department
| Department | Typical COGS (% of retail price) | Primary Cost Driver | Spoilage Baked Into COGS |
|---|---|---|---|
| Center-Store Packaged Goods | 75%–85% | Invoice cost, minimal freight variance | 1%–2% |
| Dairy/Refrigerated | 65%–75% | Commodity input costs (milk, eggs), cold-chain freight | 2%–4% |
| Frozen Foods | 65%–75% | Cold-chain freight, energy-intensive storage | 1%–2% |
| Meat/Seafood | 60%–70% | Commodity/cattle-cycle pricing, service labor not in COGS | 3%–5% |
| Produce | 55%–65% | Highly volatile — weather, tariffs on imports, seasonality | 5%–10% (highest of any department) |
| Bakery (in-store) | 40%–50% | Flour/ingredient cost low relative to labor (labor sits outside COGS) | 3%–5% |
| Deli/Prepared Foods | 35%–45% | Ingredient cost is a small share of price; labor drives the rest | 5%–8% |
| Private Label (all categories) | 60%–70% of comparable national-brand COGS ratio | No brand premium built into invoice cost | Same as category baseline |
Data derived from cross-referencing industry gross margin benchmarks against category-level COGS structures; consistent with FMI Food Industry Facts and PLMA sourcing benchmarks.
The Practical Takeaway
Produce is simultaneously your highest-shrink and most price-volatile category — its COGS ratio can swing 10+ points in a single quarter when a tariff hits imported tomatoes or avocados, or when a weather event disrupts a growing region. Deli and bakery look like “high margin” on a gross-margin table, but that’s because labor, not COGS, is the dominant cost there — cutting deli COGS by negotiating with your protein supplier moves the needle far less than fixing labor scheduling in that department. Center-store packaged goods is where blended-rate vendor negotiations and case-pack optimization have the most leverage, because COGS (not labor or shrink) is almost the entire cost structure. To optimize this further, consider implementing a private label grocery strategy.
How Discounts, Promotions, and Trade Allowances Change Your Real COGS
This is the part most COGS guides skip entirely, and it’s where the actual number on your income statement can diverge sharply from what you assumed when you built your budget.
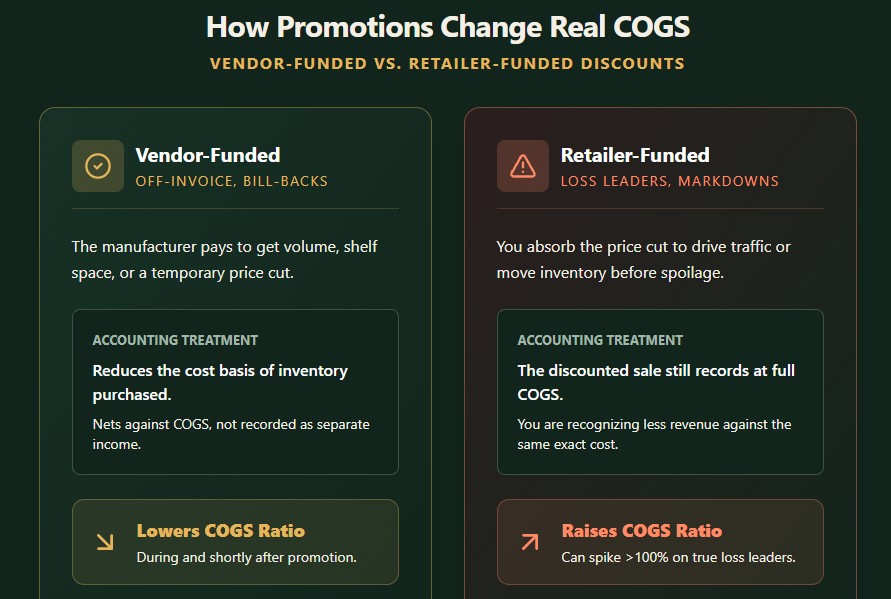
Two Separate Discount Flows — and They Hit COGS Differently
| Flow | What It Is | Accounting Treatment | Effect on Your COGS |
|---|---|---|---|
| Vendor-funded trade promotions (off-invoice allowances, bill-backs, scan-backs, slotting fees) | The manufacturer pays to get volume, shelf space, or a temporary price cut | Reduces the cost basis of inventory purchased — nets against COGS, not recorded as separate income (per ASC 606 guidance on consideration paid to a customer) | Lowers COGS ratio during and shortly after the promotional period |
| Retailer-funded promotions (loss leaders, weekly ad specials priced below cost, markdowns on aging perishables) | You absorb the price cut to drive traffic or move inventory before spoilage | The discounted sale still records at full COGS — you’re just recognizing less revenue against the same cost | Raises your effective COGS ratio (as % of revenue) on promoted SKUs, sometimes above 100% on true loss leaders |
Why this trips up new operators: a “20% off” circular ad on a national brand item is very often funded 40%–70% by the manufacturer through a temporary price reduction allowance — your actual landed cost on that case barely moved, and your COGS ratio on the promotion is close to normal. But a rotisserie chicken priced below wholesale cost, or milk sold at break-even, hits your books at full cost against a discounted sale price — that’s a real COGS-ratio spike on those specific SKUs, offset (in theory) by higher-margin items in the same basket. If your reporting doesn’t separate these two flows at the SKU level, your category managers can’t tell the difference between “this promotion is working because the manufacturer is subsidizing it” and “this promotion is working because we’re eating margin and hoping for basket lift.”
Common Trade Allowance Types and Typical Funding Levels
| Allowance Type | Typical Level | How It Nets Against COGS |
|---|---|---|
| Off-invoice allowance | 2%–8% of invoice cost | Deducted directly from the invoice before it hits your books |
| Bill-back / scan-back rebate | 1%–5% of qualifying purchases, paid quarterly | Recorded as a COGS credit in the period earned, sometimes lagging the sale |
| Co-op buying group patronage (AWG, IGA, Unified Grocers-style) | Historically ~2.5%–2.8% of qualifying warehouse purchases, paid annually | Reduces effective annual COGS retroactively — a meaningful year-end adjustment for members |
| New-item slotting fee | $250–$1,000/item/store (paid to you, not deducted from invoice) | Typically recorded as other income, not a COGS offset — check your accountant’s treatment |
Source: AWG shareholder/patronage disclosures (historical range 2.49%–2.79% of qualifying purchases), PLMA supplier guidelines
Operational implication: if you’re an independent not currently in a buying co-op, that 2.5%–2.8% annual patronage rebate is close to pure COGS reduction with no offsetting cost beyond membership fees ($5,000–$15,000) and branding compliance. On a $10M grocer buying $7M–$7.5M in COGS annually, that’s roughly $175,000–$210,000 a year in rebate value most non-co-op independents are leaving on the table.
Where POS and ERP systems fit: manually reconciling off-invoice allowances, bill-backs, and scan-backs against hundreds of vendor invoices a month is exactly the kind of task that erodes accuracy at the independent-grocer scale. Modern grocery-specific POS and ERP platforms (NCR Voyix, IT Retail, and similar supermarket-grade systems) increasingly automate this by matching incoming invoices against negotiated allowance terms, flagging discrepancies, and feeding a net (post-allowance) cost directly into inventory valuation rather than the gross invoice price. That matters directly for the accuracy of the COGS formula above — a system posting gross invoice cost instead of net cost will overstate your COGS and understate your margin on every promoted SKU until someone manually corrects it at reconciliation. If you’re still doing this reconciliation in a spreadsheet at month-end, it’s worth asking your POS vendor specifically whether their system supports allowance-level cost tracking, not just price and quantity.
Shrink: Where COGS Meets “Cost You Never Recover”
Shrink deserves its own line in your thinking because it behaves differently from normal COGS — it’s cost you’ve already booked with zero revenue to offset it. Learn more about shrinkage in grocery stores and how to reduce it.
| Metric | Value | Source |
|---|---|---|
| Grocery-sector shrink (historical benchmark) | 3.2%–3.6% of sales | National Retail Security Survey (grocery sector specifically runs meaningfully above the all-retail average) |
| All-retail average shrink (2024) | ~2% of sales, $121.6B total | National Retail Federation |
| Ready-to-eat/ready-to-heat category shrink | 5%–15% of category revenue | McKinsey analysis of supermarket categories, cited in Progressive Grocer’s shrink coverage |
| Self-checkout lane shrink | 3.5% of sales, ~16x cashier-lane rate (0.21%) | Grabango computer-vision study of ~5,000 transactions, reported via Supermarket News and CSP Daily News |
| Produce department shrink | 5%–10% | Highest of any core department — perishability + handling damage; consistent with FMI/PLMA category benchmarking |
Why this belongs in a COGS conversation, not just a “loss prevention” one: normal spoilage (the milk that expires on schedule at a predictable rate) is arguably a legitimate cost of doing business in perishables and gets absorbed into your category-level COGS assumptions. Theft, administrative error, and vendor shortages are a different animal — they inflate your effective COGS without any corresponding demand signal, which means they distort your pricing and reordering decisions if you don’t track them separately. A produce department showing “58% COGS” that’s actually 50% COGS plus 8% unaccounted shrink will lead you to underprice the category or overbuy trying to compensate for phantom stockouts.
Phantom Inventory: How Unrecorded Shrink Quietly Inflates Your Calculated COGS
Here’s the mechanism worth understanding explicitly, because it’s the reason two stores with identical real-world performance can report very different COGS numbers.
Your perpetual inventory system (the one feeding your weekly COGS ratio) assumes every unit that leaves the building is either a sale or a recorded write-off. When shrink happens without being recorded — a case damaged in the back room and thrown out without a write-off entry, a partial-scan self-checkout loss, an item that walks out the door — the system still believes that unit is sitting on the shelf. That’s phantom inventory: stock your books say exists but that physically doesn’t.
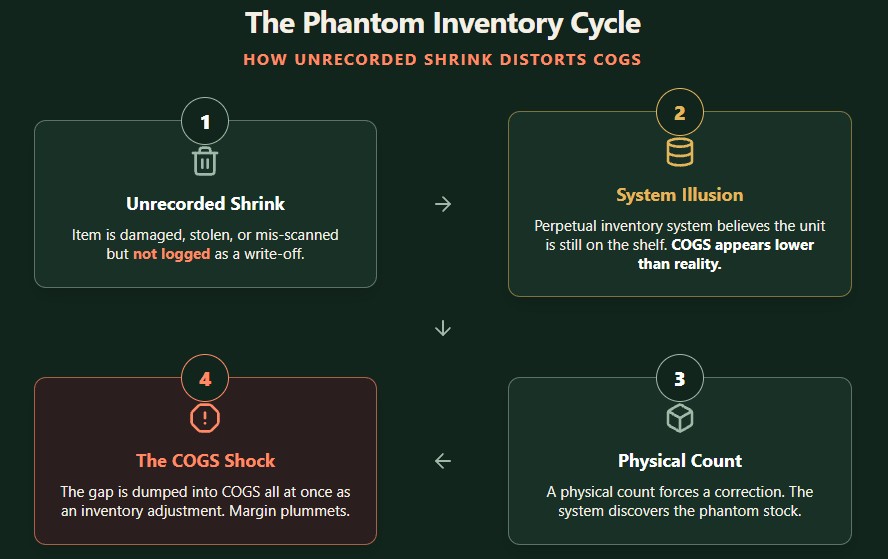
The knock-on effect is direct: your reordering logic (whether manual or AI-driven) sees inventory-on-hand as higher than reality, so it under-orders — until the shelf actually goes empty and a stockout forces a rush reorder, or until your next physical inventory count forces a correction. When that correction happens, the gap between what your system believed and what’s actually on the shelf gets dumped into COGS all at once, as an inventory adjustment. That’s why COGS numbers between physical counts should be read as provisional — the real number, including all unrecorded shrink, only becomes visible at the point of a physical count, and a store that only counts annually is running 11 months on an estimate that skews progressively more optimistic (lower apparent COGS, higher apparent margin) the longer it’s been since the last count.
Practical fix: cycle-count high-shrink departments (produce, meat, self-checkout-heavy center-store categories) monthly rather than waiting for the annual full-store count, so phantom inventory gets caught and corrected in smaller, more frequent adjustments instead of one large distorting entry at year-end. Monitoring your inventory turnover ratio can help identify these discrepancies earlier.
State-by-State Nuances That Actually Touch COGS
Most “state differences” in grocery economics (labor cost, rent, minimum wage) hit operating expenses, not COGS. But a handful of state-level rules do change your landed cost of goods directly — and they’re easy to miss when you’re using a national vendor cost sheet.
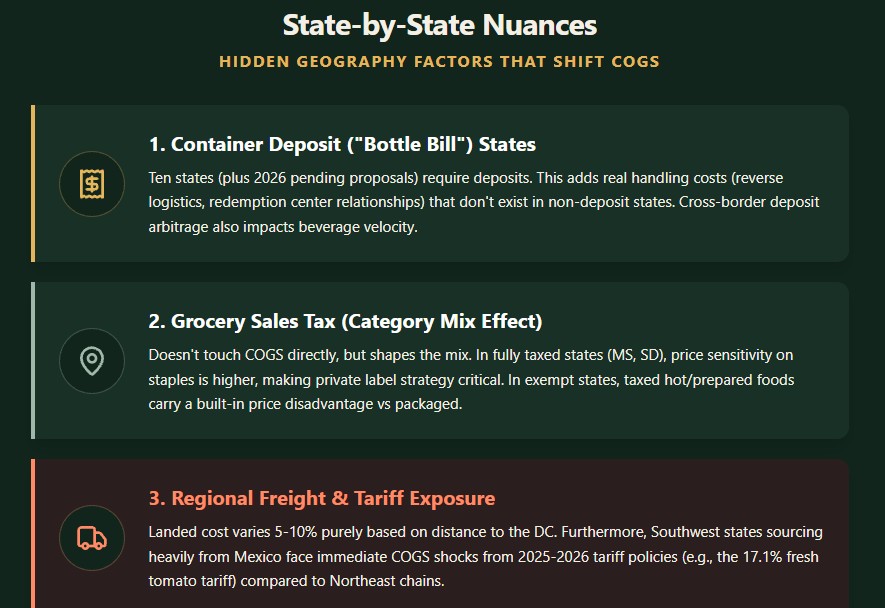
1. Container Deposit (“Bottle Bill”) States Add Real Landed Cost on Beverages
Ten states plus a handful of pending 2026 proposals require a per-container deposit that flows through the distributor to the retailer before reaching the consumer. This isn’t a tax on your P&L in the traditional sense — you collect it and remit it — but it changes unit economics, shelf pricing psychology, and requires handling infrastructure (reverse logistics for redemption in most bottle-bill states) that has a real cost.
| State | Deposit Level | Recent Change |
|---|---|---|
| California | 5¢ (<24oz) / 10¢ (≥24oz) / 25¢ (wine/spirits boxes, pouches) | Expanded to wine and spirits containers effective Jan 2024, per California Senate Bill 1013 |
| Connecticut | 10¢ (raised from 5¢) | Increased Jan 2024 under Connecticut’s Bottle Bill; further redemption-rate and licensure changes moving through the legislature in 2026 (SB 299, SB 516) |
| Michigan, Iowa, Massachusetts, New York, Hawaii, Oregon, Vermont, Maine | 5¢–15¢ depending on state and container type | Varies by state; New Hampshire’s own bottle-deposit proposal (HB 1679) was considered and rejected in its 2026 session |
COGS-relevant impact: if you operate in or near a bottle-bill state, your beverage category needs a distinct handling-cost line (redemption center relationships, reverse logistics, or in-house redemption if you choose to offer it) that doesn’t exist in non-deposit states. Retailers near a state border also see cross-border “deposit arbitrage” behavior that affects beverage category velocity and should factor into how aggressively you price that category locally.
2. Grocery Sales Tax Status Doesn’t Touch COGS — But It Shapes the Category Mix That Does
Grocery sales tax is remitted by the consumer, not embedded in your cost of goods — but it’s worth naming because it’s the state-level rule most commonly (and incorrectly) assumed to affect COGS. What it does affect is demand elasticity and category mix in taxed states:
| State Type | 2026 Status | Practical Effect on Category Strategy |
|---|---|---|
| Full exemption (most states) | Groceries untaxed; prepared/hot foods, candy, soda usually still taxed | Prepared foods and beverage categories carry a built-in price disadvantage vs. packaged groceries — factor into your deli/hot bar pricing |
| Full-rate states (Mississippi ~7%, South Dakota ~4.2%–4.5%) | Groceries taxed at the standard state rate | Price sensitivity on staples is measurably higher; private label and loss-leader strategy matter more here |
| Reduced-rate/phase-out states (Alabama, Illinois, Arkansas, Missouri, Virginia proposals) | Rates stepping down through 2026–2027 | Track legislative changes annually — a mid-year rate cut is effectively a demand tailwind you should plan promotions around |
Source: TaxJar, AARP state tax tracking, ITEP analysis, 2026 legislative filings
3. Regional Freight and Tariff Exposure Varies by Distance and Import Mix
This is the least discussed but most direct state-level COGS lever: your landed cost on the same SKU can differ 5%–10% between a store 50 miles from a distribution center and one 400 miles away, purely on inbound freight. Layer on 2025–2026 tariff policy — the U.S. imposed a 17.09% tariff on fresh Mexican tomatoes in July 2025 after terminating the decades-old Tomato Suspension Agreement [Virginia Tech AAEC, 2025], and separate USMCA-related tariff actions have threatened rates up to 25% on other Mexican produce categories — and produce COGS in Southwest/border states sourcing heavily from Mexico is exposed differently than a Northeast chain sourcing more from Eastern seaboard or domestic growing regions. Mexico supplies roughly 51% of U.S. fresh fruit imports and 69% of fresh vegetable imports by value, with avocados alone at close to 90% Mexican-sourced [USDA data cited via AFN industry analysis] — so if more than 40%–50% of a category’s supply comes through a single import corridor, that category’s COGS is now a trade-policy bet, not just a commodity bet, worth mapping explicitly rather than discovering at the next tariff announcement.
Seven Ways to Actually Reduce COGS (Ranked by Typical Impact)
Reducing COGS in grocery isn’t about beating up a single supplier on price once a year — it’s a portfolio of smaller, compounding moves.
1. Join or Renegotiate a Buying Co-op
Typical impact: 2%–3% of qualifying purchase volume, paid as an annual rebate. As shown above, co-op patronage (AWG-style) has historically run 2.5%–2.8% of qualifying purchases. If you’re already a member, confirm you’re hitting every qualifying-volume tier — most co-ops have step-up rebate tiers that reward consolidating more categories through the co-op’s warehouse rather than splitting purchases across multiple wholesalers.
2. Convert 15%–20% of Volume in Low-Loyalty Categories to Private Label
Typical impact: COGS ratio on converted volume drops from ~74%–76% (national brand) to ~62%–68% (private label). This is the single highest-leverage move in categories like milk, eggs, paper goods, and canned goods, where brand loyalty is already low. (Full sourcing, SKU-selection, and financial modeling for this is covered in our private label strategy playbook.)
3. Deploy AI Demand Forecasting to Cut Perishable Spoilage
Typical impact: 15%–25% reduction in shrink-related COGS on perishable categories, 6–18 month payback. Tools built for grocery demand forecasting (the same category referenced in cost-to-open budgeting: $5,000–$20,000 one-time plus $200–$600/month) directly reduce the “normal spoilage” component baked into produce, dairy, and bakery COGS by improving order accuracy against actual sell-through.
4. Separate Vendor-Funded from Retailer-Funded Promotions in Your Reporting
Typical impact: not a direct dollar reduction, but prevents COGS-ratio blind spots that lead to over-discounting. If your POS/accounting system can’t distinguish a manufacturer-subsidized promotion from a store-funded loss leader, you cannot accurately judge whether a promotion is COGS-neutral or COGS-negative. This is a reporting fix, not a negotiation — and it’s usually a one-time system configuration project.
5. Right-Size Case Packs and Order Quantities Against Distributor MOQs
Typical impact: 3%–5% reduction in effective unit cost on categories currently over-ordered to meet minimums. Distributor MOQs ($2,500–$5,000 per SKU is typical) push new and small operators to buy more than optimal, creating a choice between shrink/write-off risk and holding cost. Reviewing your MOQ-driven SKUs quarterly against actual velocity — and shifting slow movers to a regional wholesaler with lower MOQs even at a 5%–10% higher unit cost — often nets a lower total landed cost once shrink is factored in.
6. Maintain EDI Compliance to Avoid Penalty Fees That Inflate Effective COGS
Typical impact: avoids 3% fees on shorted shipments and other non-compliance penalties. Distributors like UNFI and KeHE enforce fill-rate and on-time-delivery standards (98% inbound fill rate, 92% on-time delivery is typical) with real financial penalties for non-compliance — new stores without experienced buyers routinely lose $3,000–$10,000 in unexpected fees in their first few months, which shows up as inflated COGS with no corresponding negotiating lever to fix it after the fact.
7. Map Category-Level Import/Tariff Exposure and Diversify Sourcing Where It’s Concentrated
Typical impact: avoids 10%–25% COGS spikes on affected categories during tariff events. This won’t lower baseline COGS, but it reduces volatility — which matters just as much when you’re running on a 1.5%–2.5% net margin and can’t absorb a sudden double-digit cost shock on a high-volume category like produce.
Worked Example: COGS Reduction on a $10M Independent Grocer
| Scenario | Annual COGS | Change |
|---|---|---|
| Baseline (no co-op, no private label, 76% blended COGS ratio) | $7,600,000 | — |
| + Join buying co-op (2.6% rebate on qualifying purchases, ~85% of volume qualifies) | $7,432,000 | −$168,000 |
| + Convert 15% of volume to private label (COGS ratio on that slice: 65% vs. 76%) | $7,247,000 | −$185,000 additional |
| + AI forecasting cuts perishable shrink-related COGS by 20% on produce/dairy/bakery (~18% of total COGS) | $7,116,000 | −$131,000 additional |
| Total after three interventions | $7,116,000 | −$484,000 (−6.4 points on blended COGS ratio) |
Against $10M in revenue, that’s roughly 4.8 percentage points of net margin recovered — enough to move a store from FMI’s 2024–2025 industry benchmark of 1.7% net margin into the 5%–6% range typically associated with specialty/organic formats, without touching a single price on the shelf. Use our break-even analysis tools to model how these savings impact your profitability timeline.
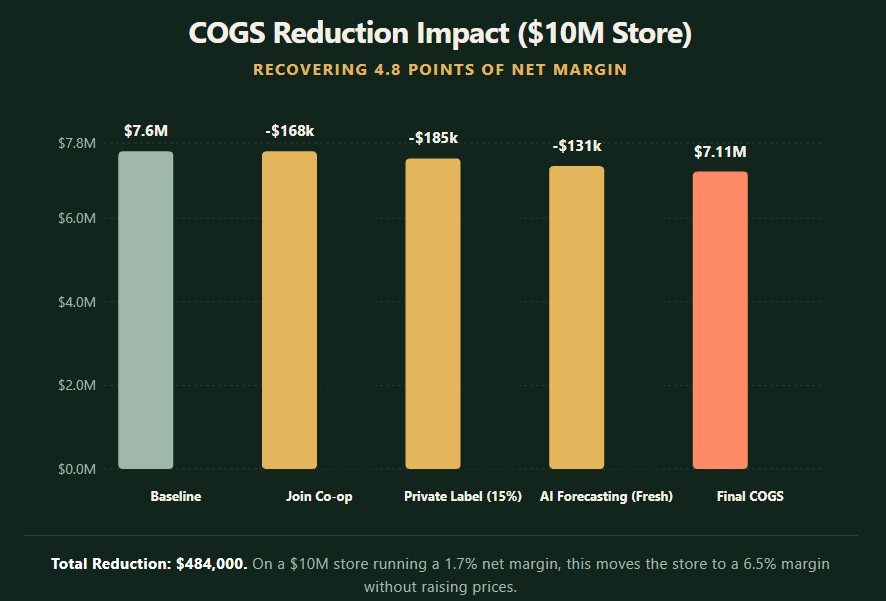
Note: illustrative model based on the benchmarks cited throughout this article. Actual results depend on category mix, existing supplier terms, and execution quality — treat this as a framework for building your own numbers, not a guaranteed outcome.
Common Mistakes That Inflate COGS Without Anyone Noticing
| Mistake | Why It Happens | Fix |
|---|---|---|
| Tracking invoice price only, ignoring freight and allowances | Simple POS/accounting setup, no dedicated category management | Reconcile landed cost quarterly, not just at year-end tax time |
| Treating all “sale pricing” as margin-negative | No distinction between vendor-funded and retailer-funded promotions | Tag promotions by funding source in your system |
| Over-ordering to meet distributor MOQs | New accounts lack negotiating leverage | Review MOQ-driven SKUs against actual velocity quarterly |
| No department-level COGS targets | Managing to a single blended number | Set COGS targets by department, not store-wide |
| Missing co-op or rebate tier thresholds | No one tracks qualifying volume against tier breakpoints | Assign rebate-tier tracking to a specific person, reviewed monthly |
| Ignoring regional tariff/import exposure until a price shock hits | Category management treats sourcing as fixed | Map supplier country-of-origin exposure by category annually |
2026–2028 Outlook: What Changes the COGS Conversation Next
- Tariff pass-through peaks April–October 2026 on produce categories sourced from Mexico — fresh tomatoes are already carrying a 17.09% tariff since July 2025, with avocados, berries, and other Mexican-sourced produce categories exposed to further USMCA-related tariff action of up to 25% [Virginia Tech AAEC, 2025] — meaning COGS volatility in produce is a near-term planning issue, not a hypothetical.
- Private label penetration climbing toward 28%–30% of unit volume by 2028 structurally lowers blended COGS ratios for chains that lean into conversion now, per the trajectory covered in our private label playbook.
- AI-driven procurement and demand forecasting adoption is accelerating — FMI’s 2026 Food Retailing Industry Speaks report found 68% of food retailers now use AI in some form, up from 47% a year earlier, with average tech spend nearly doubling as a share of sales. Shrink reduction and buying optimization are the two most directly COGS-relevant applications.
- Bottle-bill and beverage-container legislation is actively moving in several states in 2026 sessions (Connecticut, New Hampshire proposals among others) — beverage category handling costs are not a static assumption.
- Regulatory compliance costs are rising — FMI reports more than half of suppliers and over a third of retailers expect increased compliance expenses in 2025–2026, which increasingly shows up embedded in vendor invoice pricing rather than as a clean, separate line.
Bottom Line
COGS isn’t a single number you calculate once for taxes — it’s a department-by-department, promotion-by-promotion, state-by-state set of decisions that compound. The stores winning on this line aren’t necessarily negotiating harder on unit price; they’re capturing rebates they already qualify for, converting the right categories to private label, separating vendor-funded promotions from their own margin-eating ones, and treating shrink as a distinct, trackable cost rather than a rounding error inside “cost of goods.” On a $10M grocer running FMI’s industry-average 1.7% net margin ($170,000 in annual profit), closing even half the COGS gap modeled above (roughly $242,000) would more than double the bottom line to over $400,000 — without a single change to what’s on the shelf or what customers pay for it. Effective cash flow management is essential to sustain these improvements. When planning your initial setup, ensure you understand licensing and permit requirements and consider whether to buy or lease commercial real estate. If additional capital is needed for inventory or technology, explore options on how to get a small business loan. Finally, a comprehensive business plan will help integrate these COGS strategies into your overall financial model.